Fig. B.1
Download original image
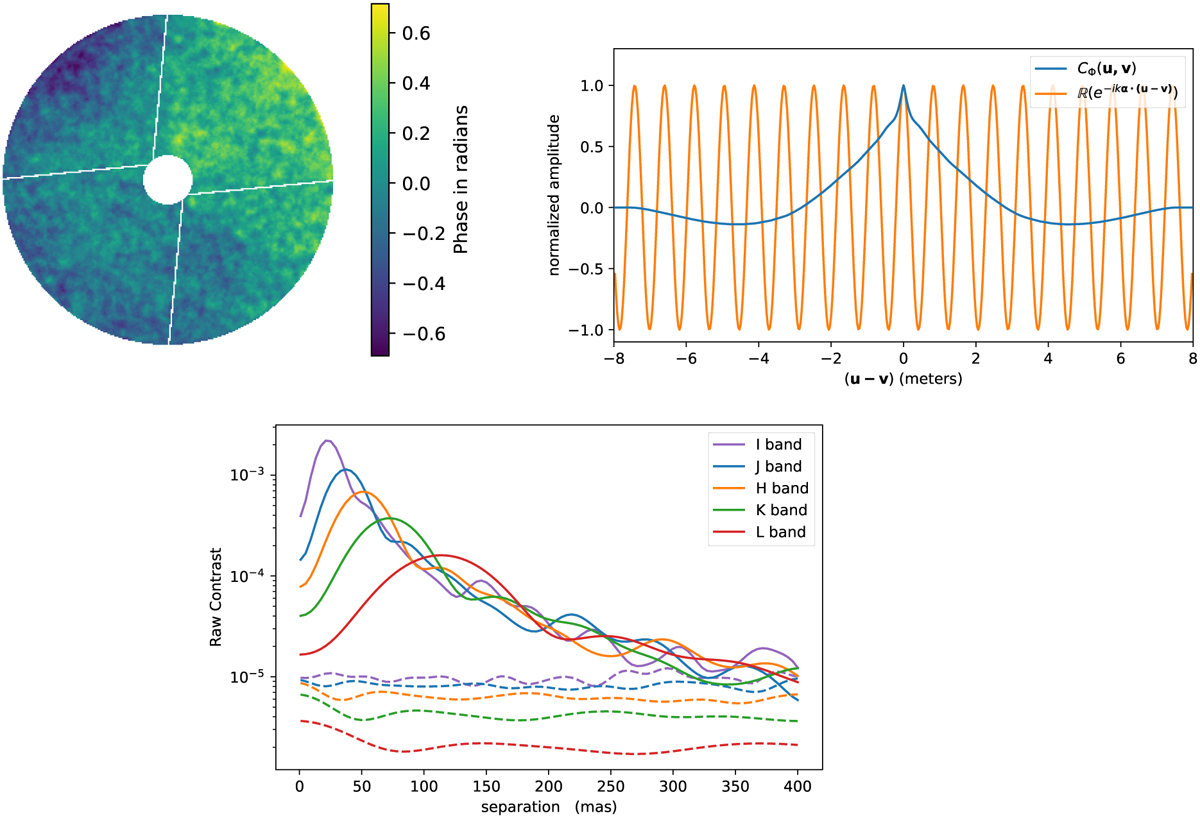
Raw contrast of atmospheric residual as a function of wavelength. Upper left panel: Instantaneous phase map obtained using HCIPy simulations (parameters for the AO system are detailed in Section 2.5.3), yielding a Strehl ratio of 97.8% in the K band. Upper right panel: Normalised autocorrelation function of the phase map, CΦ(u,v) (blue curve), overlaid with the real part of e−ikα⋅(u,v) for an object at a separation of 200 mas in the I band. The scalar product of these two functions gives the residual flux injected into the fibre, ![]() . Lower panel: Raw contrast as a function of wavelength and angular separation, assuming two cases: (i) solid lines represent
. Lower panel: Raw contrast as a function of wavelength and angular separation, assuming two cases: (i) solid lines represent ![]() assuming a correlated phase noise (as in our simulation), and (ii) dashed lines represent the raw contrast if we would have uncorrelated phase noise (CΦ(u,v) = cte).
assuming a correlated phase noise (as in our simulation), and (ii) dashed lines represent the raw contrast if we would have uncorrelated phase noise (CΦ(u,v) = cte).
Current usage metrics show cumulative count of Article Views (full-text article views including HTML views, PDF and ePub downloads, according to the available data) and Abstracts Views on Vision4Press platform.
Data correspond to usage on the plateform after 2015. The current usage metrics is available 48-96 hours after online publication and is updated daily on week days.
Initial download of the metrics may take a while.