Fig. 10
Download original image
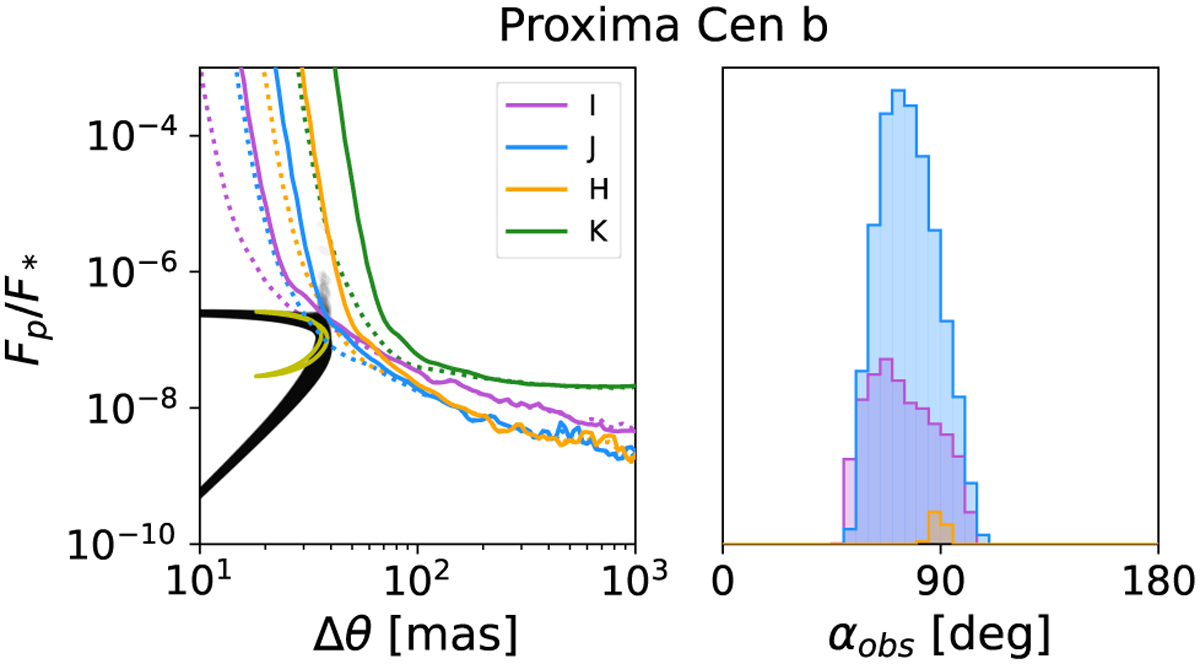
Detectability conditions for Proxima Cen b with the extended VLTI configuration. Left panel show the simulated orbits (black lines) assuming A𝑔 = 0.3, as well as the mean orbital realisation (as shown in Figs. 4–6) in yellow. Coloured lines show the detectability limits of the interferometer at each spectral band with the VLTI (solid lines) and the extended VLIT (Fig. 8, dotted lines) configurations. In this case, we show the detectability limits for a S/N = 3 in 30 h of integration time, instead of 3 h. The histograms on the right panel show the range of αobs at each band.
Current usage metrics show cumulative count of Article Views (full-text article views including HTML views, PDF and ePub downloads, according to the available data) and Abstracts Views on Vision4Press platform.
Data correspond to usage on the plateform after 2015. The current usage metrics is available 48-96 hours after online publication and is updated daily on week days.
Initial download of the metrics may take a while.