Fig. 6
Download original image
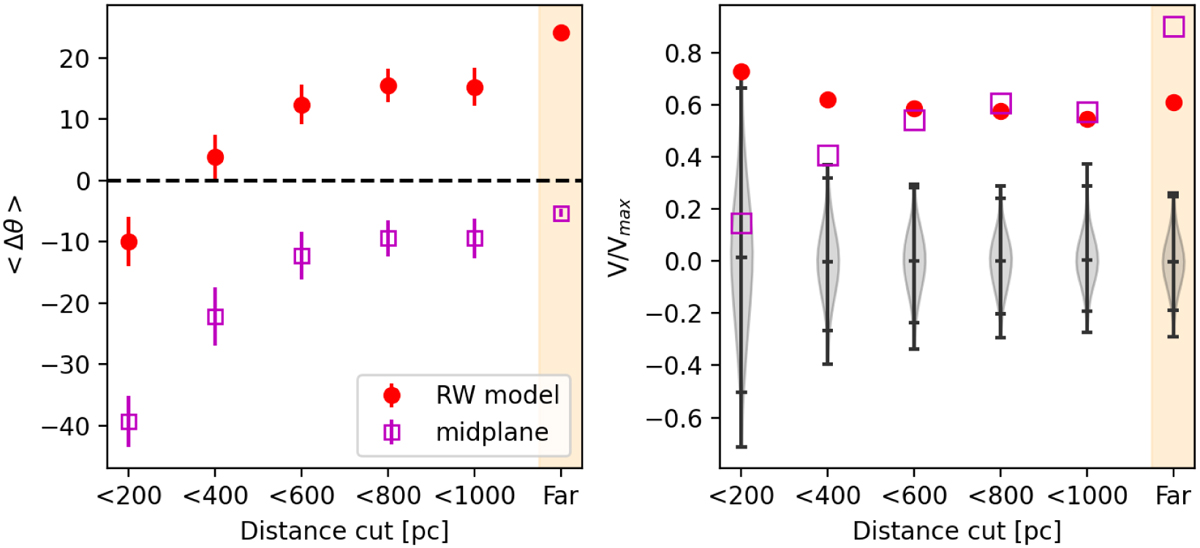
Comparison of alignment and alignment significance as a function of the maximum distance of stars. Left: circular means (〈Δθ〉). Right: normalized PRS ( V/ Vmax). Each panel shows values of these quantities computed for (a) the relative orientation of star polarization angles compared to the RW (red circles), (b) the relative orientation with respect to the midplane (magenta squares). The violin shapes show the distribution of normalized PRS values obtained for a uniform distribution of angles for the same uncertainties as the corresponding stellar samples. Horizontal lines mark the median, three-sigma lower and upper limits and the minimum and maximum value of each distribution.
Current usage metrics show cumulative count of Article Views (full-text article views including HTML views, PDF and ePub downloads, according to the available data) and Abstracts Views on Vision4Press platform.
Data correspond to usage on the plateform after 2015. The current usage metrics is available 48-96 hours after online publication and is updated daily on week days.
Initial download of the metrics may take a while.