Fig. 7.
Download original image
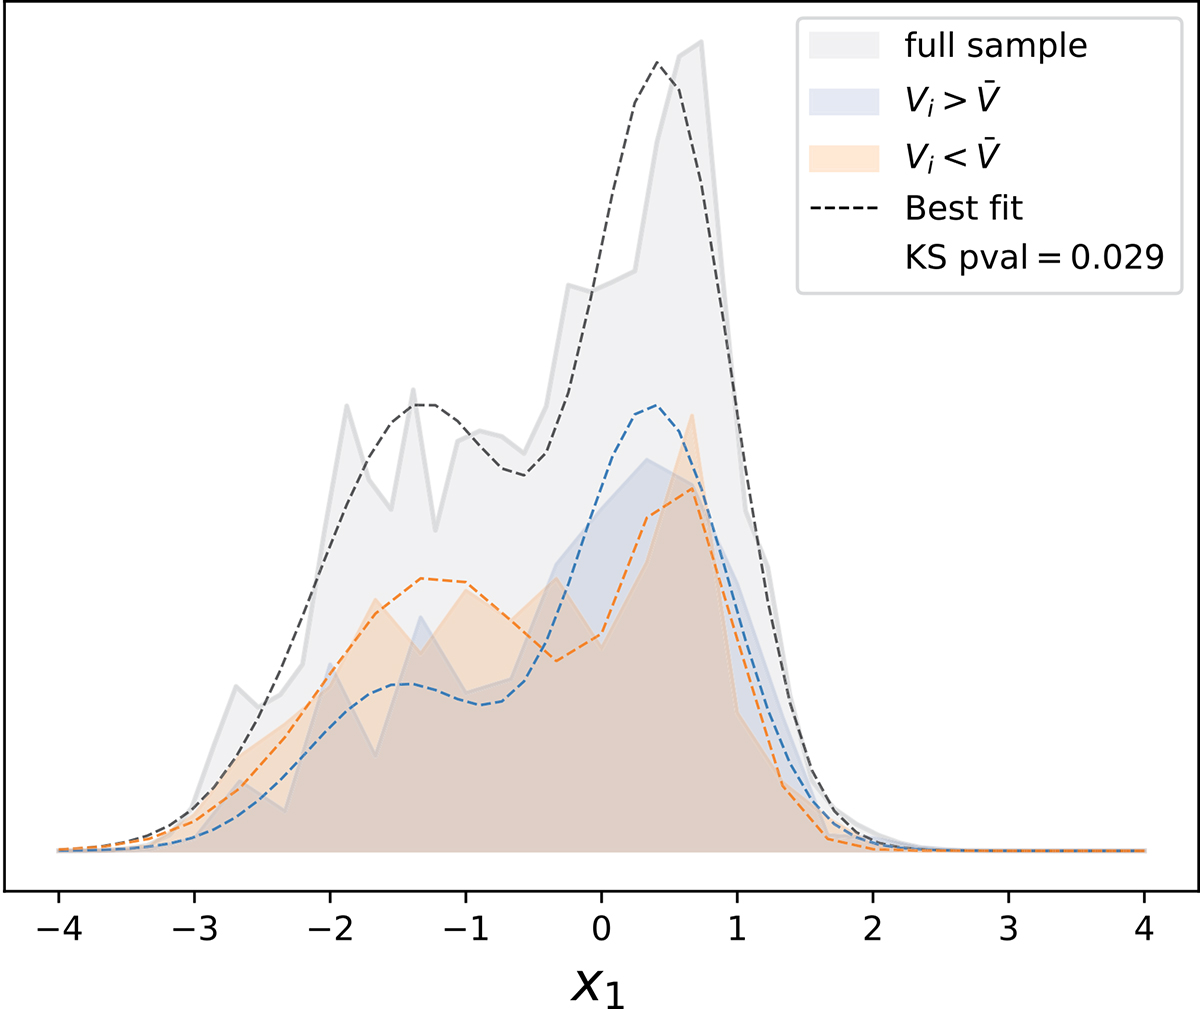
Ideograms of the stretch in the full sample (shaded black), in the low-density environment sample (shaded blue), and in the high-density environment sample (shaded orange). The distributions are superimposed with their corresponding best-fitting bimodal stretch PDF (dashed lines) defined in Eq. (3) with corresponding parameters quoted in Table 2. The p-value for the Kolmogorov-Smirnoff test applied to the low- and high-density environment is provided in the legend and implies a significant difference.
Current usage metrics show cumulative count of Article Views (full-text article views including HTML views, PDF and ePub downloads, according to the available data) and Abstracts Views on Vision4Press platform.
Data correspond to usage on the plateform after 2015. The current usage metrics is available 48-96 hours after online publication and is updated daily on week days.
Initial download of the metrics may take a while.