Fig. 6.
Download original image
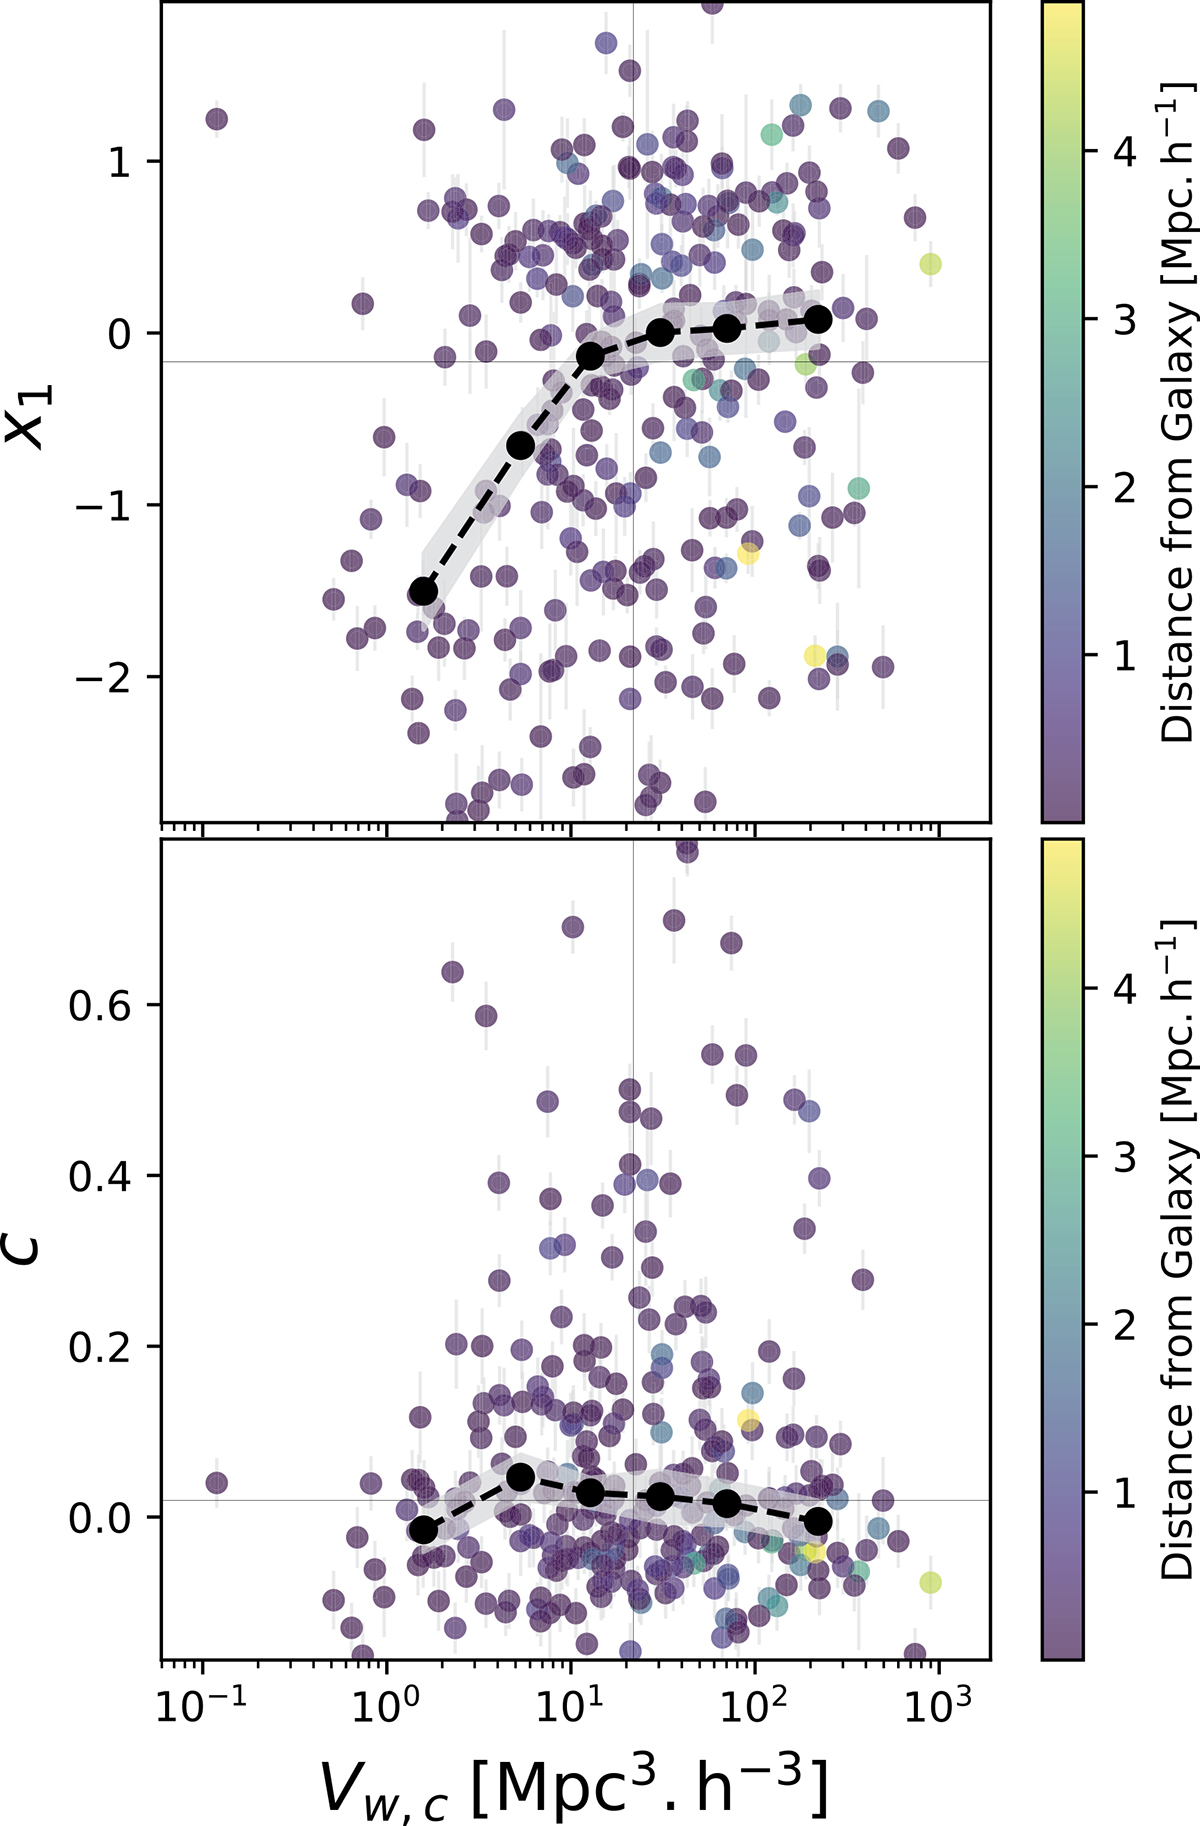
Scatter plots of the intrinsic properties of SN Ia as a function of the Voronoi volume in Mpc3 h−3 of the nearest galaxy to the SN Ia. The upper panel displays the stretch x1 and the lower panel displays the colour c of each individual matched SN Ia. The black dashed line with filled circled markers corresponds to the median value of the considered intrinsic property in each bin of volume; the volume values are taken to be the centroidal median values in each bin. The shaded grey region represents the standard deviation normalised by the count in the bin. In ascending order of volume, there are 30, 40, 65, 57, 49, and 39 SNe Ia in the bins. Vertical lines represent the median weighted Voronoi volume of the galaxies, ![]() , and horizontal lines represent the median value of the considered intrinsic parameter in the sample. The marker colour indicates the distance in Mpc h−1 from the nearest neighbouring galaxy to the SN Ia.
, and horizontal lines represent the median value of the considered intrinsic parameter in the sample. The marker colour indicates the distance in Mpc h−1 from the nearest neighbouring galaxy to the SN Ia.
Current usage metrics show cumulative count of Article Views (full-text article views including HTML views, PDF and ePub downloads, according to the available data) and Abstracts Views on Vision4Press platform.
Data correspond to usage on the plateform after 2015. The current usage metrics is available 48-96 hours after online publication and is updated daily on week days.
Initial download of the metrics may take a while.