Fig. 7
Download original image
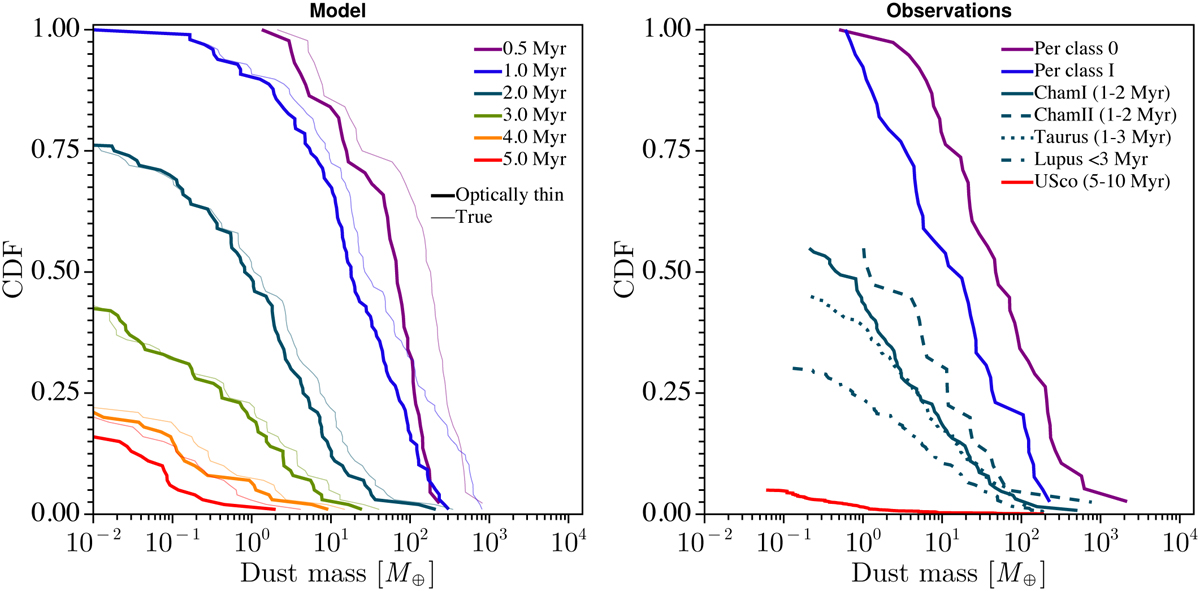
Cumulative distributions of dust masses in our model (left panel) and dust masses estimated from ALMA observations (right panel). Thin lines in the left panel show the true disc mass and the thick lines show the optically thin disc mass at λ = 1.3 mm. At most times, the differences between the two are small as discs are marginally or fully optically thin. The exception to this are the very young and massive discs, or old discs which have retained dust outside a photoevaporative gap.
Current usage metrics show cumulative count of Article Views (full-text article views including HTML views, PDF and ePub downloads, according to the available data) and Abstracts Views on Vision4Press platform.
Data correspond to usage on the plateform after 2015. The current usage metrics is available 48-96 hours after online publication and is updated daily on week days.
Initial download of the metrics may take a while.