Fig. 4
Download original image
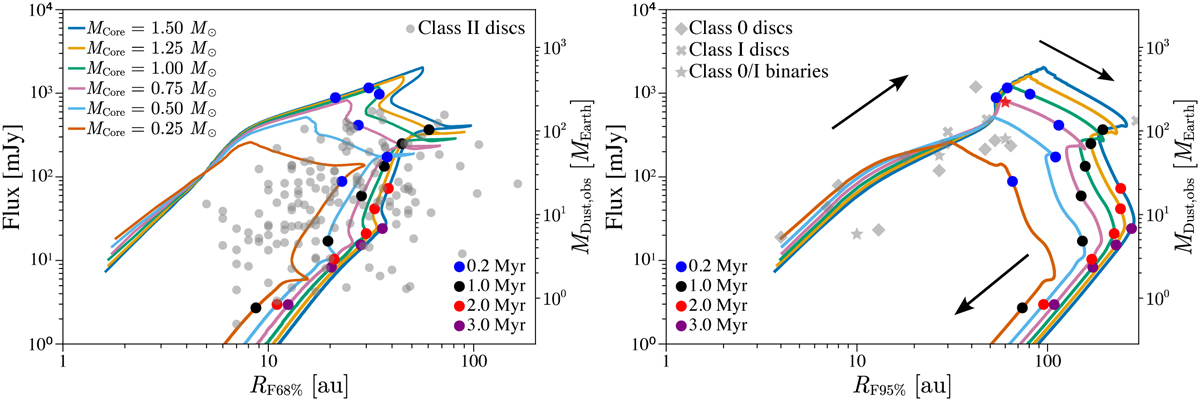
Total emitted flux at λ = 1.3 mm versus the flux radius, comparing to observed class II disc in the left panel and class 0/I discs in the right panel (gray symbols). The left and right panel show the 68 and 95% flux radius because the observational samples we compare to report 68% flux radii for the class II discs, and the class 0/I discs report the 95% flux radius. The class II sample is taken from Pascucci et al. (2016); Andrews et al. (2018a); Ansdell et al. (2018); Cieza et al. (2019); Akeson et al. (2019); van der Marel & Mulders (2021) and the class 0/I discs from Ohashi et al. (2023). We show resolved discs with measured sizes and do not include those with upper limits on their size. The arrows show the direction of the temporal evolution in this plane and the coloured dots show the ages of the model discs at a few times of their evolution. The red star indicates the disc R CrA IRS7B-a, which has indications of active viscous heating (Takakuwa et al. 2024).
Current usage metrics show cumulative count of Article Views (full-text article views including HTML views, PDF and ePub downloads, according to the available data) and Abstracts Views on Vision4Press platform.
Data correspond to usage on the plateform after 2015. The current usage metrics is available 48-96 hours after online publication and is updated daily on week days.
Initial download of the metrics may take a while.