Fig. 3
Download original image
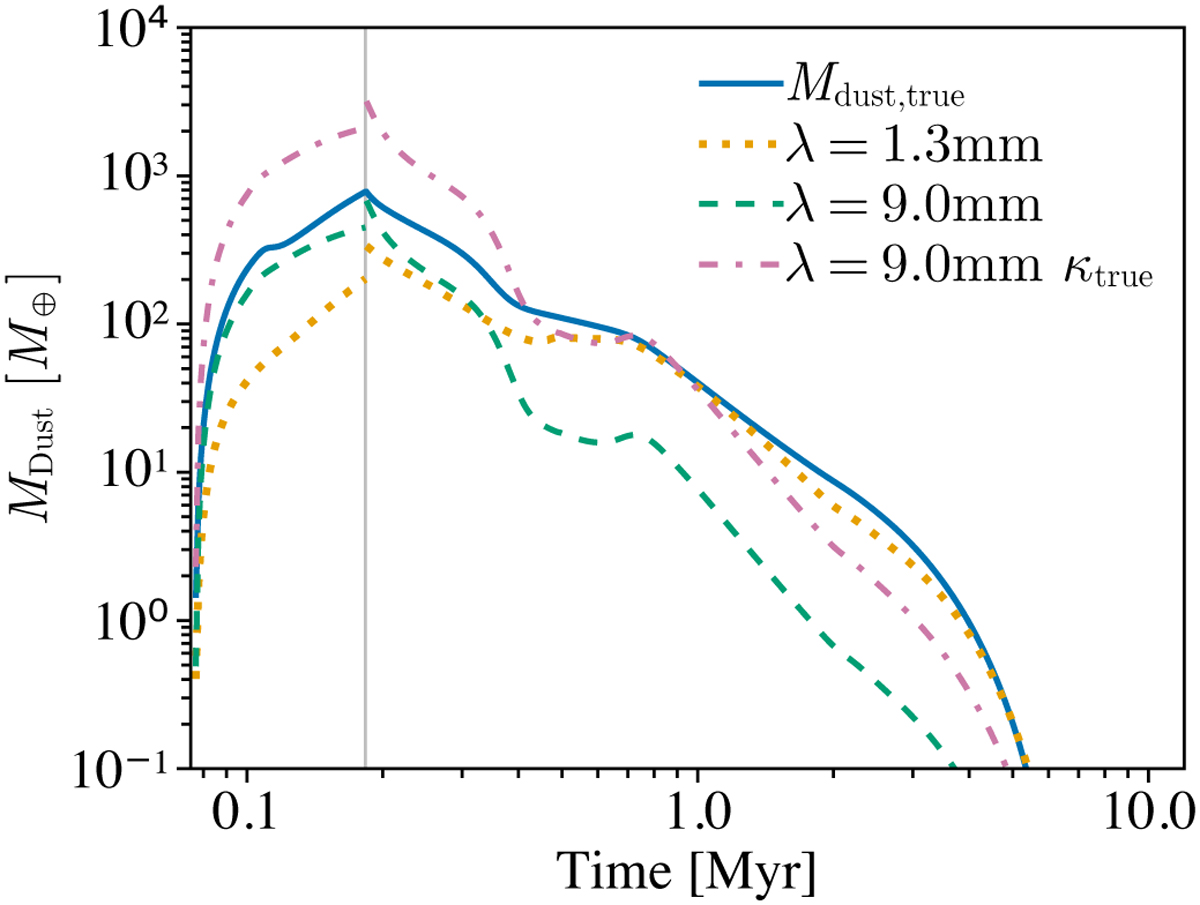
True dust mass of the model (blue), the optically thin dust mass at an observing wavelength of 1.3 mm (yellow dotted) and 9 mm (green dashed), as a function of time. The observations assume a disc temperature of 20 K during the formation of the disc (<0.18 Myr, grey vertical line) and 30 K at later times. The pink dashed-dotted line shows the 9 mm, optically thin dust mass, where the opacity used to calculate this in Eq. (1) has been set to the opacity that the Birnstiel et al. (2018) model produces at a wavelength of 9 mm and at a maximum particle size of 9 mm, i.e. the same opacity that is used to calculate the disc continuum emission. This is to highlight how the resulting optically thin dust mass can be affected by a difference in between actual disc opacity, and the scaling law (Eq. (2)) that is often used to determine the opacity in observational surveys of protoplanetary discs.
Current usage metrics show cumulative count of Article Views (full-text article views including HTML views, PDF and ePub downloads, according to the available data) and Abstracts Views on Vision4Press platform.
Data correspond to usage on the plateform after 2015. The current usage metrics is available 48-96 hours after online publication and is updated daily on week days.
Initial download of the metrics may take a while.