Fig. 6
Download original image
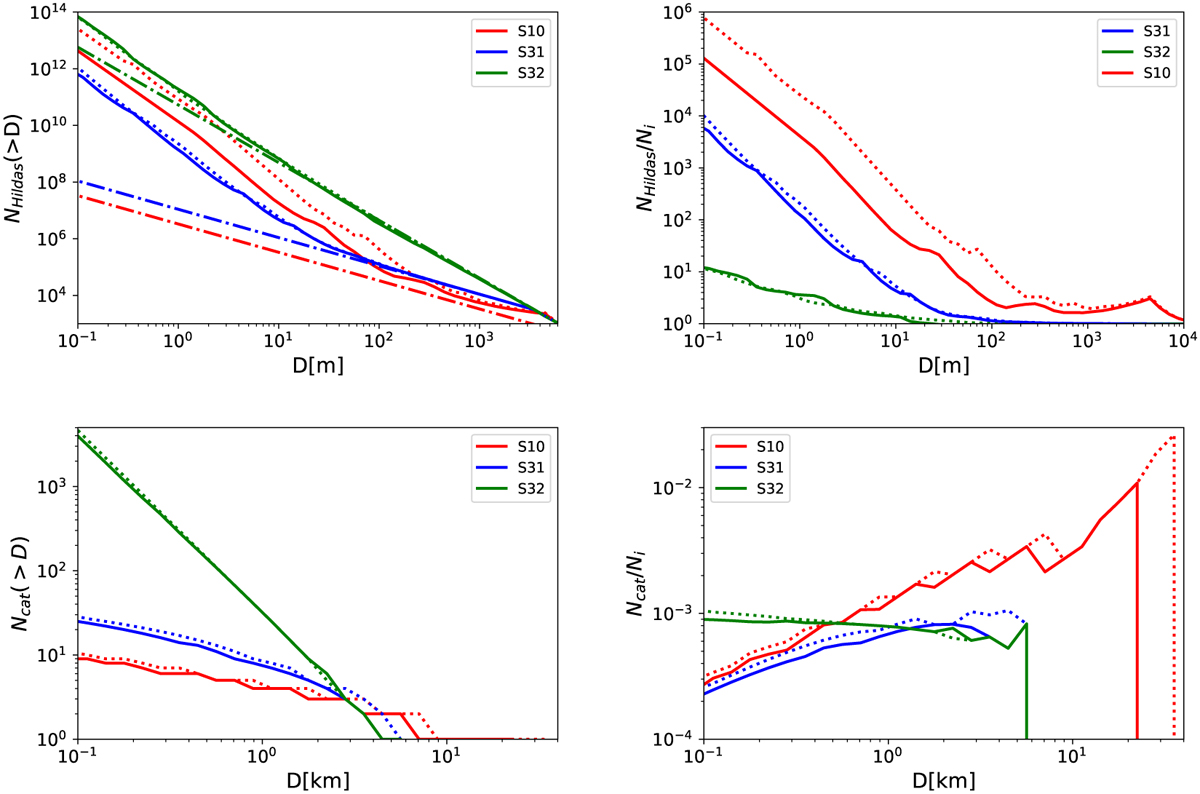
Evolution of the SFD of Hilda asteroids relative to the initial population. Top: median SFD (left) and ratio with respect to the initial SFD in the sub-kilometre size range for the S10 (red), S31 (blue), and S32 (green) scenarios. Dashed-dotted lines represent the initial SFD. Bottom: SFD of catastrophically disrupted bodies (left) and ratio of catastrophically disrupted bodies with respect to the initial SFD (right) for the S10 (red), S31 (blue), and S32 (green) scenarios. Solid lines represent simulations conducted with icy targets’ scaling laws, while dashed lines indicate simulations with basaltic targets.
Current usage metrics show cumulative count of Article Views (full-text article views including HTML views, PDF and ePub downloads, according to the available data) and Abstracts Views on Vision4Press platform.
Data correspond to usage on the plateform after 2015. The current usage metrics is available 48-96 hours after online publication and is updated daily on week days.
Initial download of the metrics may take a while.