Fig. 1
Download original image
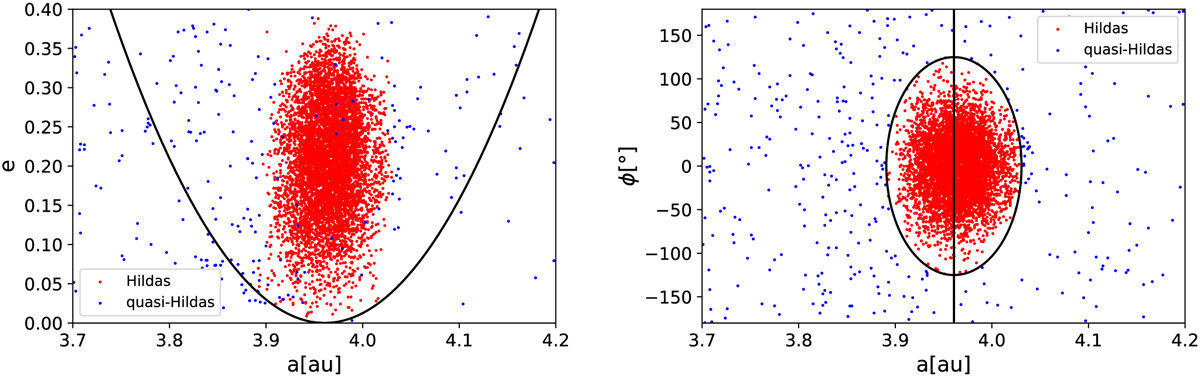
Distribution of Hilda asteroids (depicted in red) and quasi-Hilda objects (depicted in blue) presented in the (a, e) plane (left) and (a, Φ) plane. The black ellipse in the left panel indicates the limits between the Hilda and quasi-Hildas regions, whereas the black curve in the right panel indicates the separatrix of the 3:2 MMR.
Current usage metrics show cumulative count of Article Views (full-text article views including HTML views, PDF and ePub downloads, according to the available data) and Abstracts Views on Vision4Press platform.
Data correspond to usage on the plateform after 2015. The current usage metrics is available 48-96 hours after online publication and is updated daily on week days.
Initial download of the metrics may take a while.