Fig. 4
Download original image
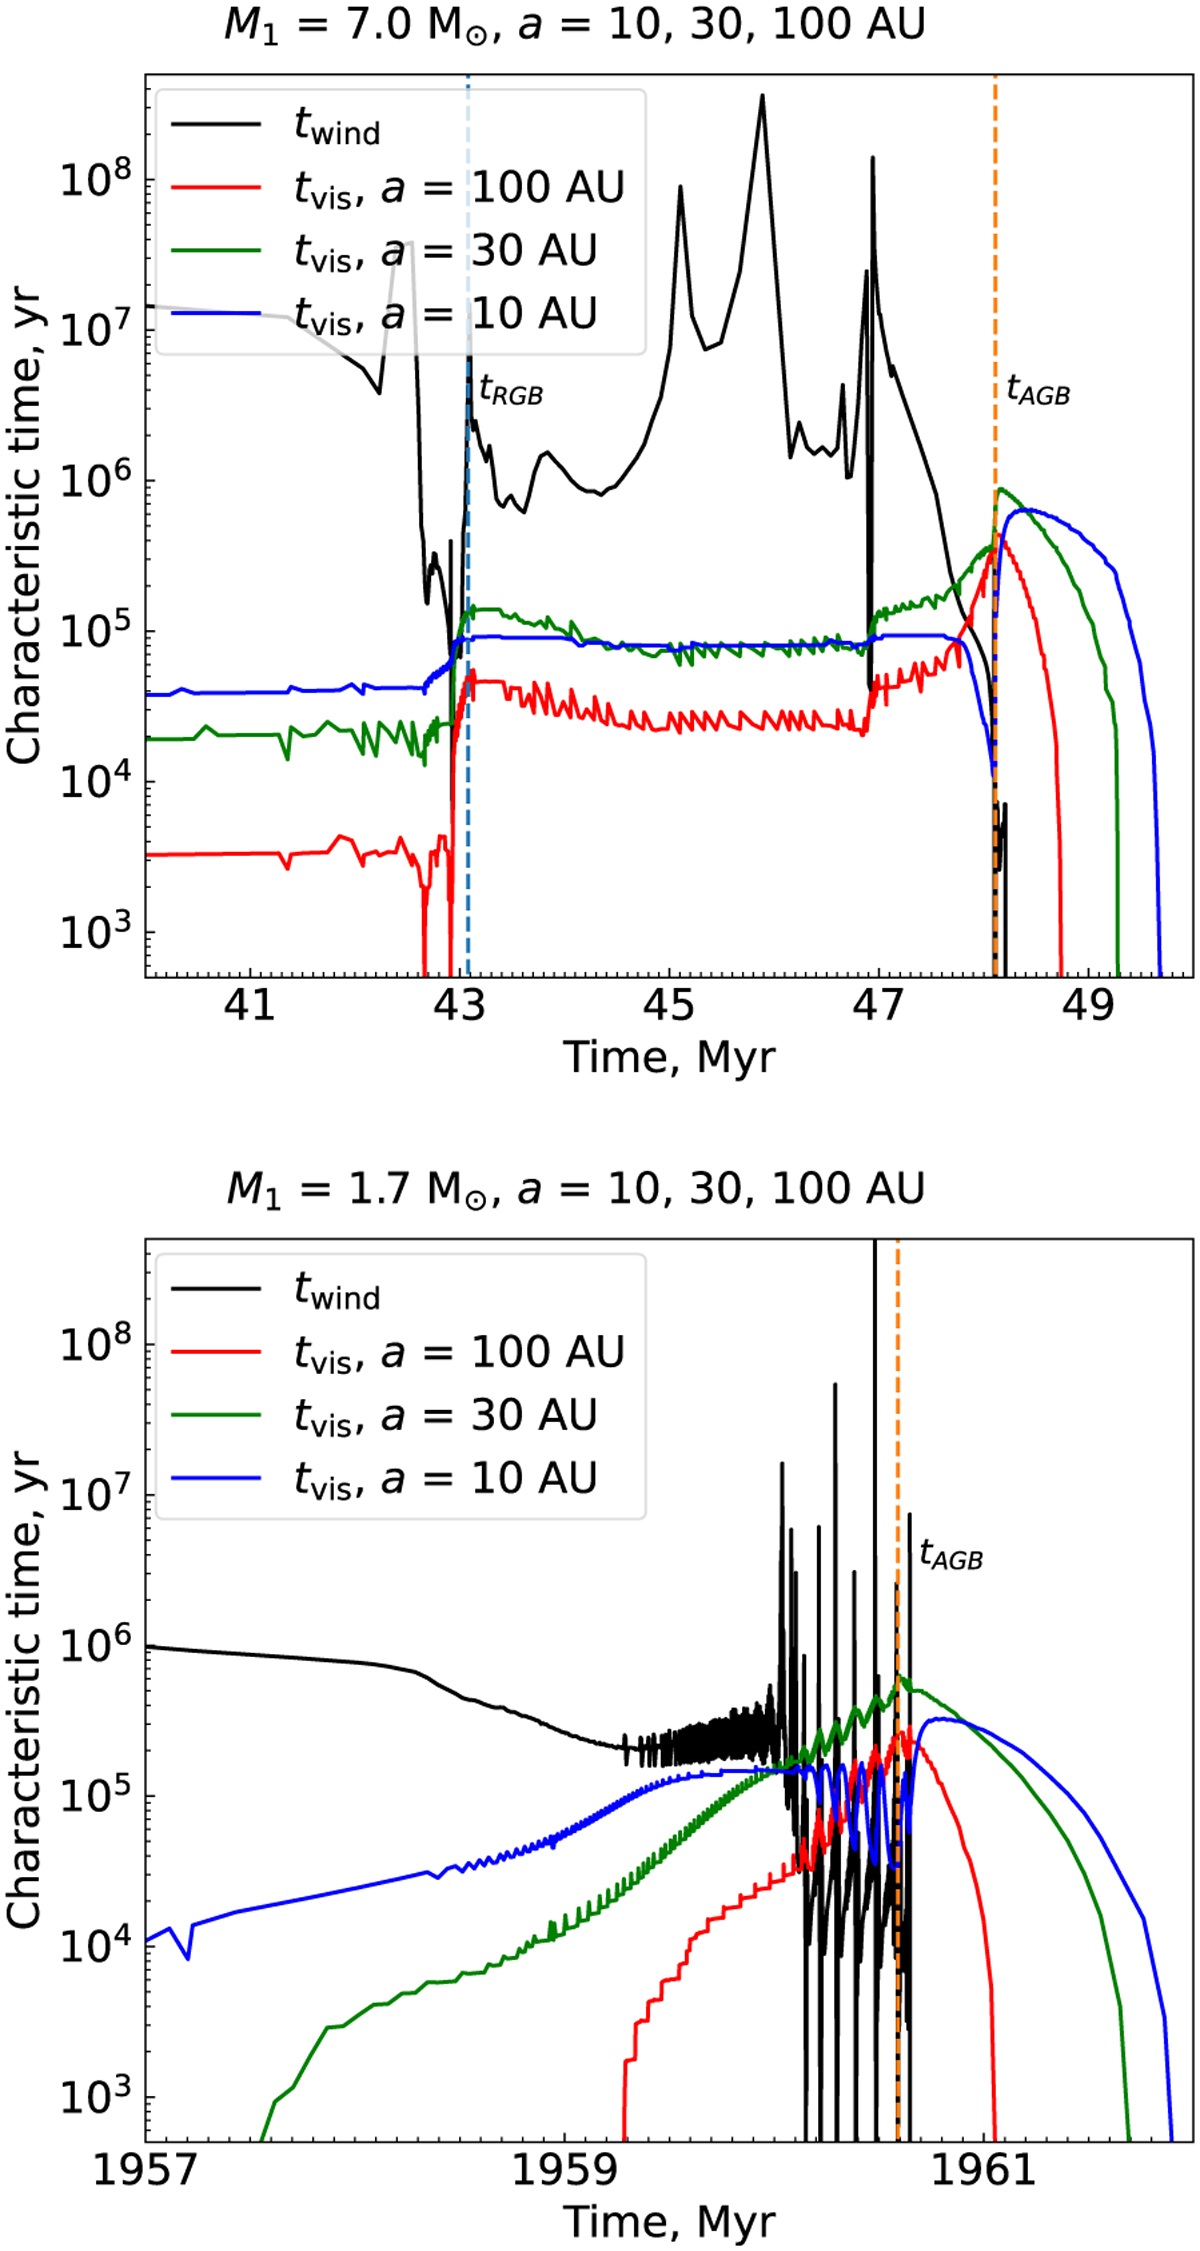
Disk viscous and wind variability timescales for two donors and three initial separations over the disk evolution. Black curve: characteristic timescale of wind variability, ![]() . Blue, green, and red curves: characteristic viscous timescale of the disk, tν = r2/ν, taken at the outer boundary of NS disk in the system with initial separations a = 10, 30, 100 AU, respectively. The initial donor mass M1 = 7.0 M⊙ and M1 = 1.7 M⊙ on the top and the bottom panels, respectively.
. Blue, green, and red curves: characteristic viscous timescale of the disk, tν = r2/ν, taken at the outer boundary of NS disk in the system with initial separations a = 10, 30, 100 AU, respectively. The initial donor mass M1 = 7.0 M⊙ and M1 = 1.7 M⊙ on the top and the bottom panels, respectively.
Current usage metrics show cumulative count of Article Views (full-text article views including HTML views, PDF and ePub downloads, according to the available data) and Abstracts Views on Vision4Press platform.
Data correspond to usage on the plateform after 2015. The current usage metrics is available 48-96 hours after online publication and is updated daily on week days.
Initial download of the metrics may take a while.