Fig. 3
Download original image
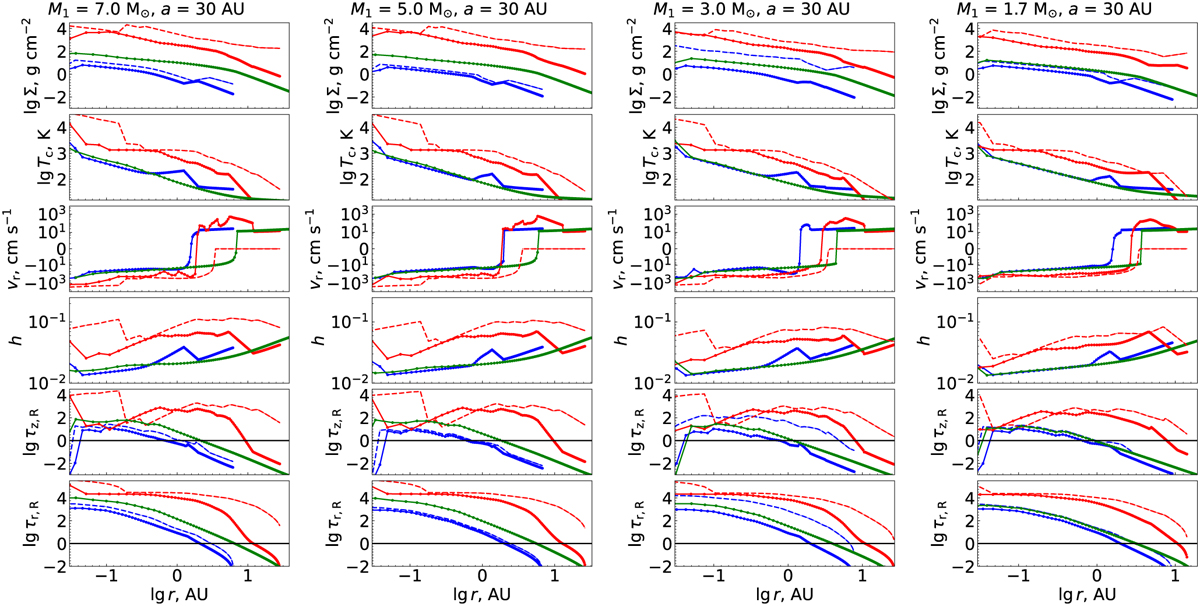
Radial profiles of the accretion disk variables. Each column corresponds to a different initial donor mass, M1, of our sample. The initial binary separation is a = 30 AU for all columns. The rows from 1 to 6 show the disk profiles of surface density Σ, midplane temperature Tc, radial velocity vr, aspect ratio h = H/r, optical thickness in vertical and radial directions τz,R, τr,R, respectively. Blue, red, and green curves represent a disk at the time t = tfrm, tAGB, tdpl, respectively (for the values of the time moments see Table 2). Solid and dashed curves show, respectively, NSD and QSD. The markers of the solid curves correspond to the spatial grid of the solution. QSD curves are presented only on plots with Σ, τz,R and τr,R, otherwise, for the moment tAGB only (see Table 4 for the values of the Bondi radius and the snow line radius).
Current usage metrics show cumulative count of Article Views (full-text article views including HTML views, PDF and ePub downloads, according to the available data) and Abstracts Views on Vision4Press platform.
Data correspond to usage on the plateform after 2015. The current usage metrics is available 48-96 hours after online publication and is updated daily on week days.
Initial download of the metrics may take a while.