Fig. F.1
Download original image
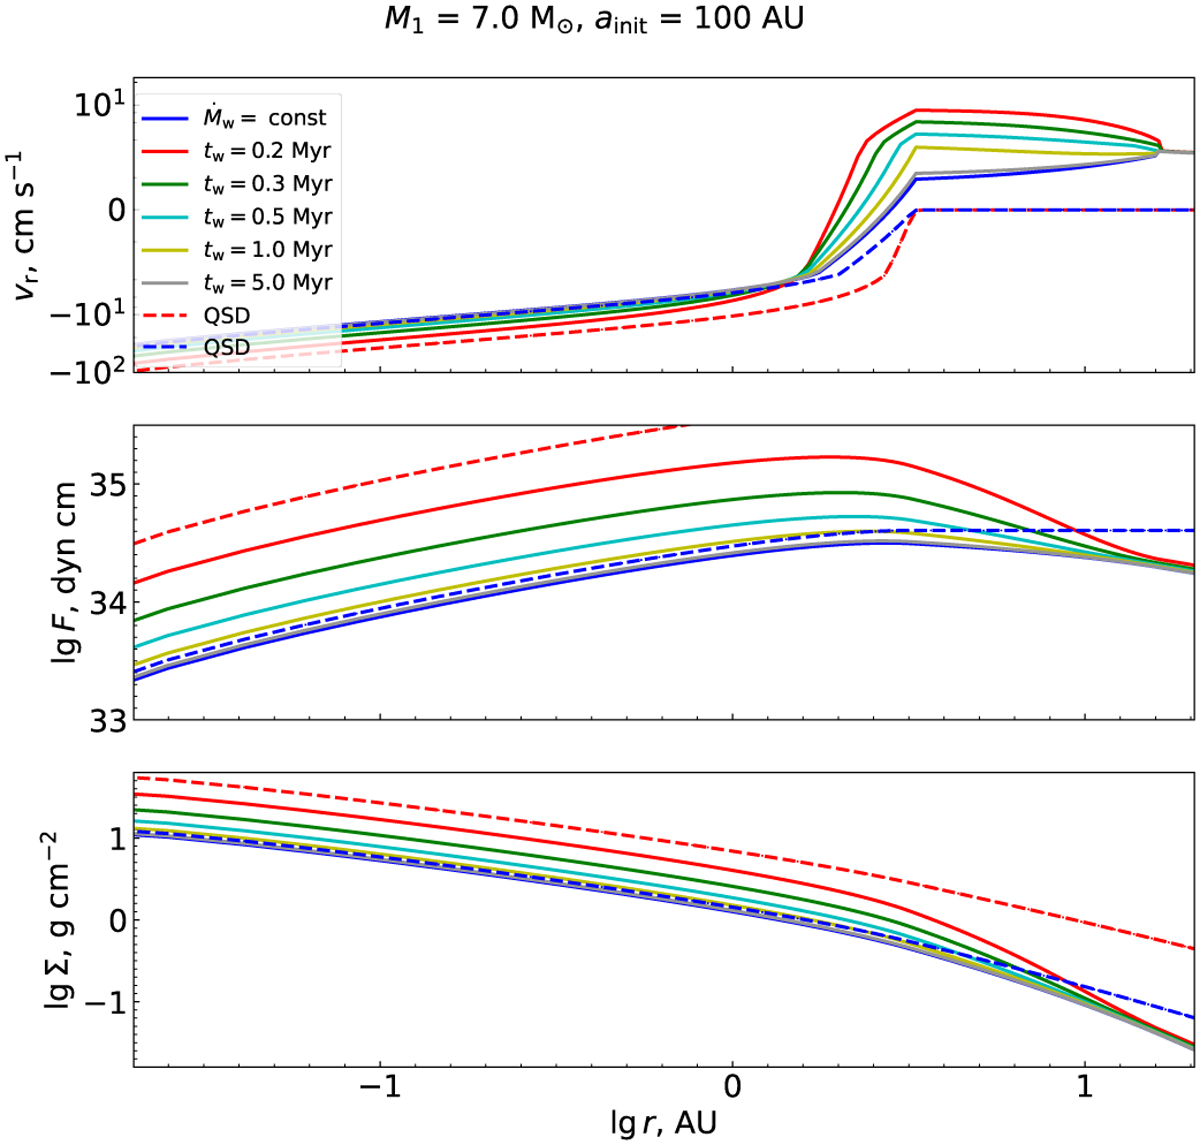
Radial velocity, viscous torque, and surface density radial profiles for the simplified NS disk model as described in Appendix F. The profiles are taken at the time moment 0.5 Myr after the start of the wind exponential growth. Before that, the disk has been accumulated from the wind with the constant rate Ṁw = 5 x 10⁻⁸ M⊙ yr−1 during 5 Myr. The solid curves with different colors correspond to different wind variation timescales, ![]() . The black, yellow, cyan, green, and red curves represent the cases of tw = 5.0,1.0,0.5,0.3,0.2 Myr, respectively. The solid blue curve shows the solution for the constant wind rate. The dashed blue curve shows the QSD solution obtained for Ṁw = 5 x 10⁻⁸ M⊙ yr−1. The dashed red curve shows the QSD solution obtained for the instant value of the wind rate attained after 0.5 Myr of its exponential growth with tw = 0.2 Myr. The initial donor mass M1 = 7.0 M⊙, the binary separation is constant a = 100 AU. In all cases, the disk satisfies the floating outer boundary condition (12).
. The black, yellow, cyan, green, and red curves represent the cases of tw = 5.0,1.0,0.5,0.3,0.2 Myr, respectively. The solid blue curve shows the solution for the constant wind rate. The dashed blue curve shows the QSD solution obtained for Ṁw = 5 x 10⁻⁸ M⊙ yr−1. The dashed red curve shows the QSD solution obtained for the instant value of the wind rate attained after 0.5 Myr of its exponential growth with tw = 0.2 Myr. The initial donor mass M1 = 7.0 M⊙, the binary separation is constant a = 100 AU. In all cases, the disk satisfies the floating outer boundary condition (12).
Current usage metrics show cumulative count of Article Views (full-text article views including HTML views, PDF and ePub downloads, according to the available data) and Abstracts Views on Vision4Press platform.
Data correspond to usage on the plateform after 2015. The current usage metrics is available 48-96 hours after online publication and is updated daily on week days.
Initial download of the metrics may take a while.