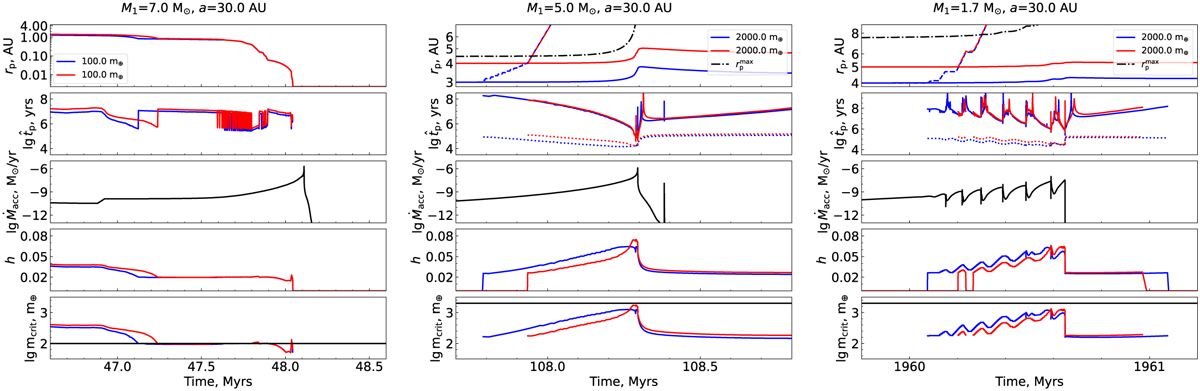
Fig. A.2
Download original image
Same as Fig. 6 but the left plot is for the planet with mp = 100 m⊕ and initial orbits rp = 2AU and 3 AU in the system with initial M1 = 7.0 M⊙ and a = 30 AU. The center plot is for the planet with mp = 2000 m⊕ and initial orbits rp = 3 AU and 4 AU in the system with initial M1 = 5.0 M⊙ and a = 30 AU. Additionally, the dashed curve shows the migration track determined by the rate of decretion. The dotted and the dot-dashed curves show, respectively, the timescale of decretion and the location of the largest dynamically stable planetary orbit. The right plot is as the center plot but for M1 = 1.7 M⊙ and for planets with initial orbits rp = 4 AU and 5 AU.
Current usage metrics show cumulative count of Article Views (full-text article views including HTML views, PDF and ePub downloads, according to the available data) and Abstracts Views on Vision4Press platform.
Data correspond to usage on the plateform after 2015. The current usage metrics is available 48-96 hours after online publication and is updated daily on week days.
Initial download of the metrics may take a while.