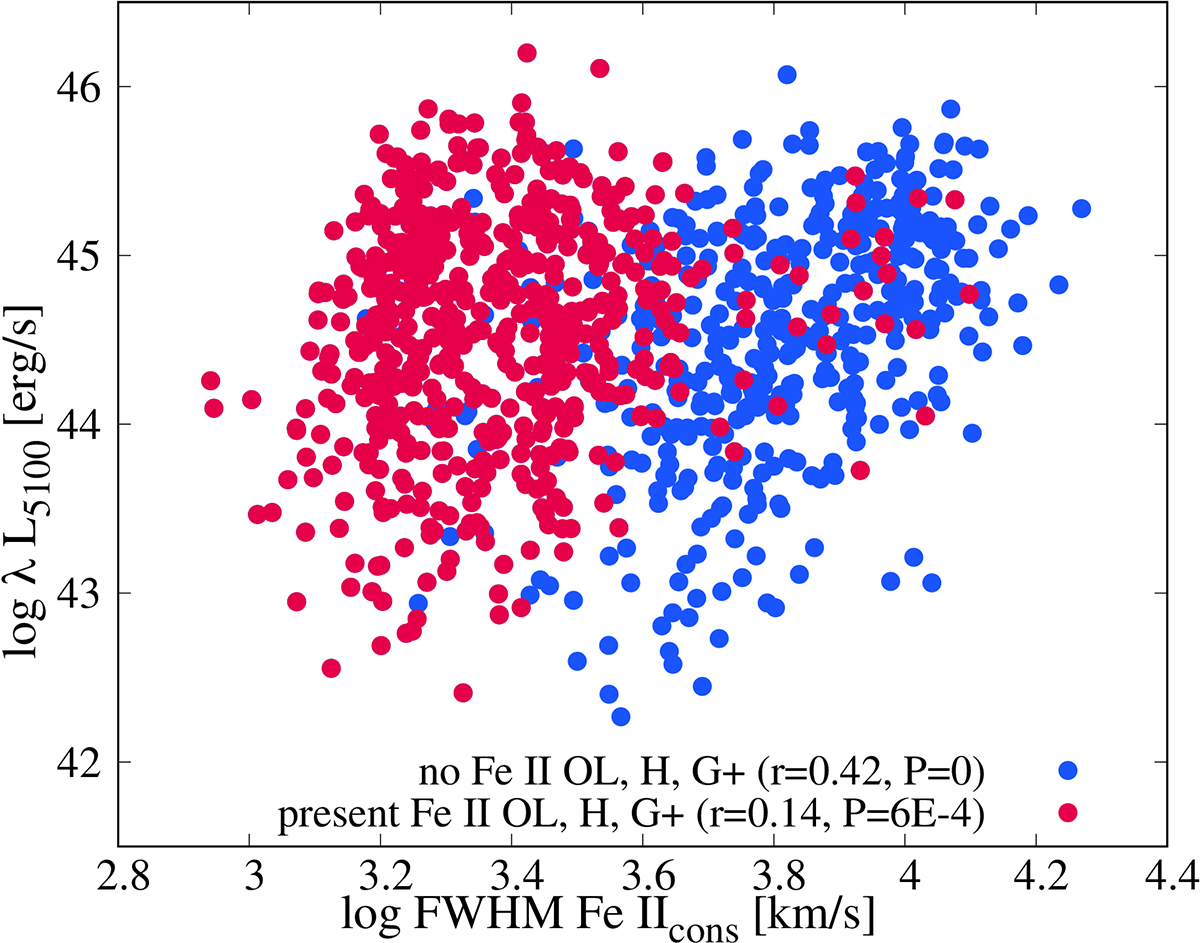
Fig. 8.
Download original image
Presence of inconsistent line groups in the sample. The blue dots represent the objects with no G+, OL, and H inconsistent line groups, while the red dots are objects with at least one of these line groups present. The Spearman coefficient of correlation (r) and P-value for log λL5100 versus log FWHM Fe IIcons are given for each subsample.
Current usage metrics show cumulative count of Article Views (full-text article views including HTML views, PDF and ePub downloads, according to the available data) and Abstracts Views on Vision4Press platform.
Data correspond to usage on the plateform after 2015. The current usage metrics is available 48-96 hours after online publication and is updated daily on week days.
Initial download of the metrics may take a while.