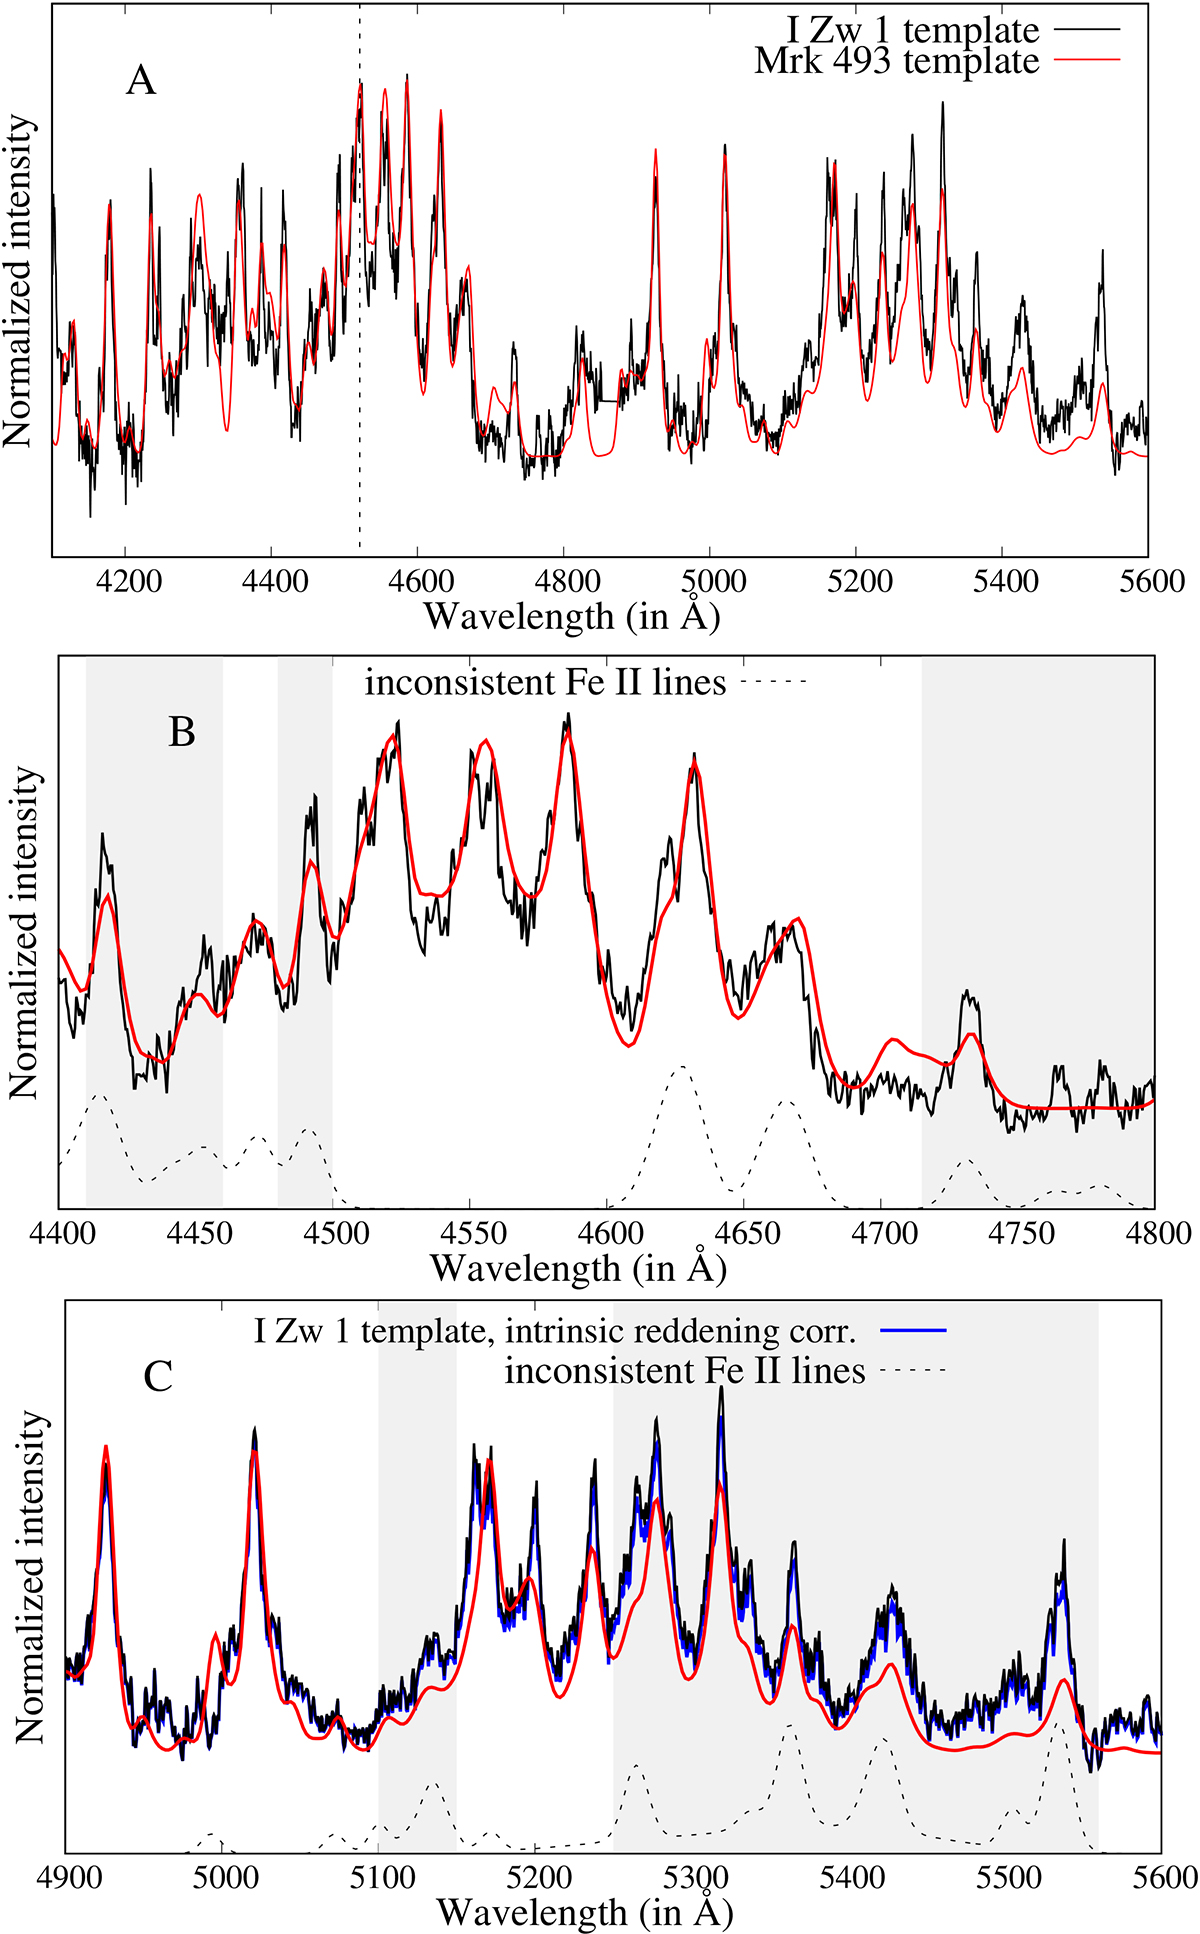
Fig. 7.
Download original image
Comparison of relative intensities of Fe II lines in I Zw 1 and Mrk 493. The black line represents the I Zw 1 Fe II template given in Boroson & Green (1992) and the red line is the Mrk 493 Fe II template given in Park et al. (2022). Both templates are scaled to have the same intensity of λ4520 Å line (see vertical dashed line in panel A). The Fe II emission bluewards to Hβ is shown separately in panel B, and the redwards the Hβ is shown separately in panel C. The shaded regions in panels B and C highlight the mismatch between two templates. The inconsistent Fe II lines obtained from our model for I Zw 1 spectrum are shown with dashed line in bottom of panels B and C. Additionally, the I Zw 1 template corrected for intrinsic reddening is shown in panel C, denoted with the blue line.
Current usage metrics show cumulative count of Article Views (full-text article views including HTML views, PDF and ePub downloads, according to the available data) and Abstracts Views on Vision4Press platform.
Data correspond to usage on the plateform after 2015. The current usage metrics is available 48-96 hours after online publication and is updated daily on week days.
Initial download of the metrics may take a while.