Open Access
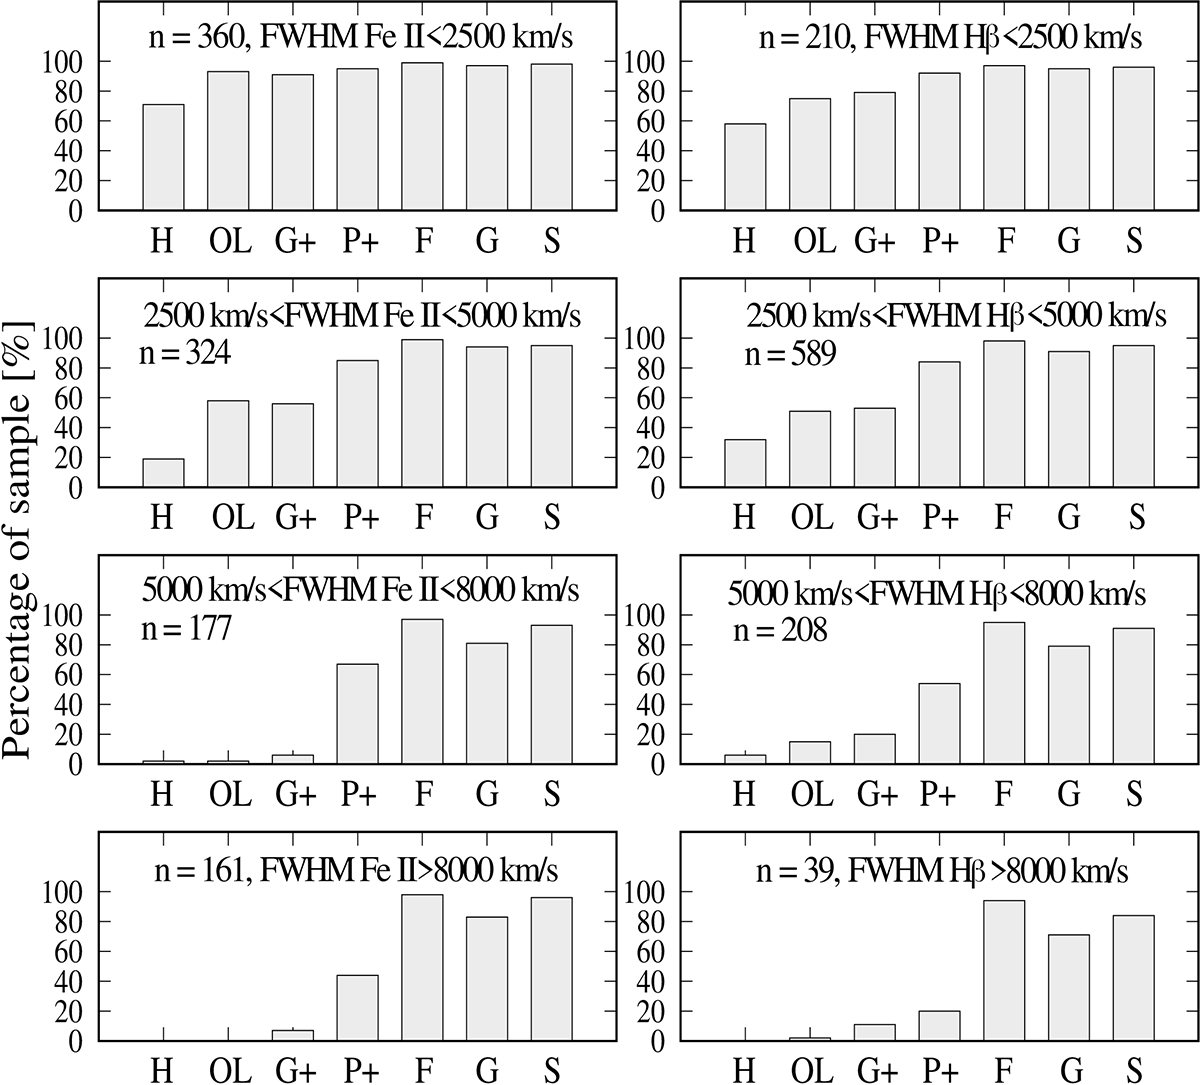
Fig. 6.
Download original image
Presence of the Fe II line groups in different subsets. The sample is divided into several subsets with n spectra following different ranges of line widths (FWHM Fe II or FWHM Hβ). The histograms show the percentage of spectra with present Fe II lines from different Fe II groups (H, OL, G+, P+, F, S, G) in each subset.
Current usage metrics show cumulative count of Article Views (full-text article views including HTML views, PDF and ePub downloads, according to the available data) and Abstracts Views on Vision4Press platform.
Data correspond to usage on the plateform after 2015. The current usage metrics is available 48-96 hours after online publication and is updated daily on week days.
Initial download of the metrics may take a while.