Fig. 3.

Download original image
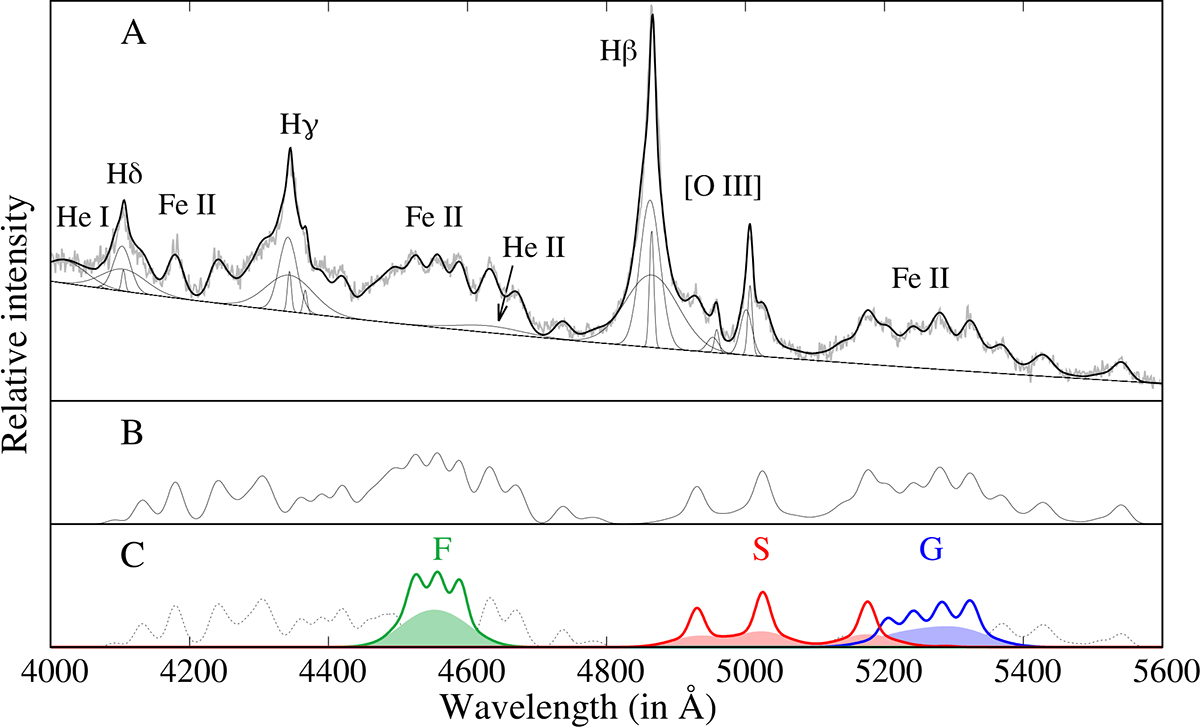
Example of the fit in the 4000–5600 Å range for SDSS J111941.12+595108.7. Panel A shows the continuum fitted with a power-law, emission lines with a single or multi-Gaussian model, and Fe II lines with a complex Fe II template, which is shown separately in panel B. Panel C shows the inconsistent Fe II lines, denoted with dotted lines, and the consistent Fe II lines, which are coloured in green (F group), red (S group), and blue (G group). The sum of the VBLR components of consistent the Fe II lines is shaded with the appropriate colour for each group.
Current usage metrics show cumulative count of Article Views (full-text article views including HTML views, PDF and ePub downloads, according to the available data) and Abstracts Views on Vision4Press platform.
Data correspond to usage on the plateform after 2015. The current usage metrics is available 48-96 hours after online publication and is updated daily on week days.
Initial download of the metrics may take a while.


