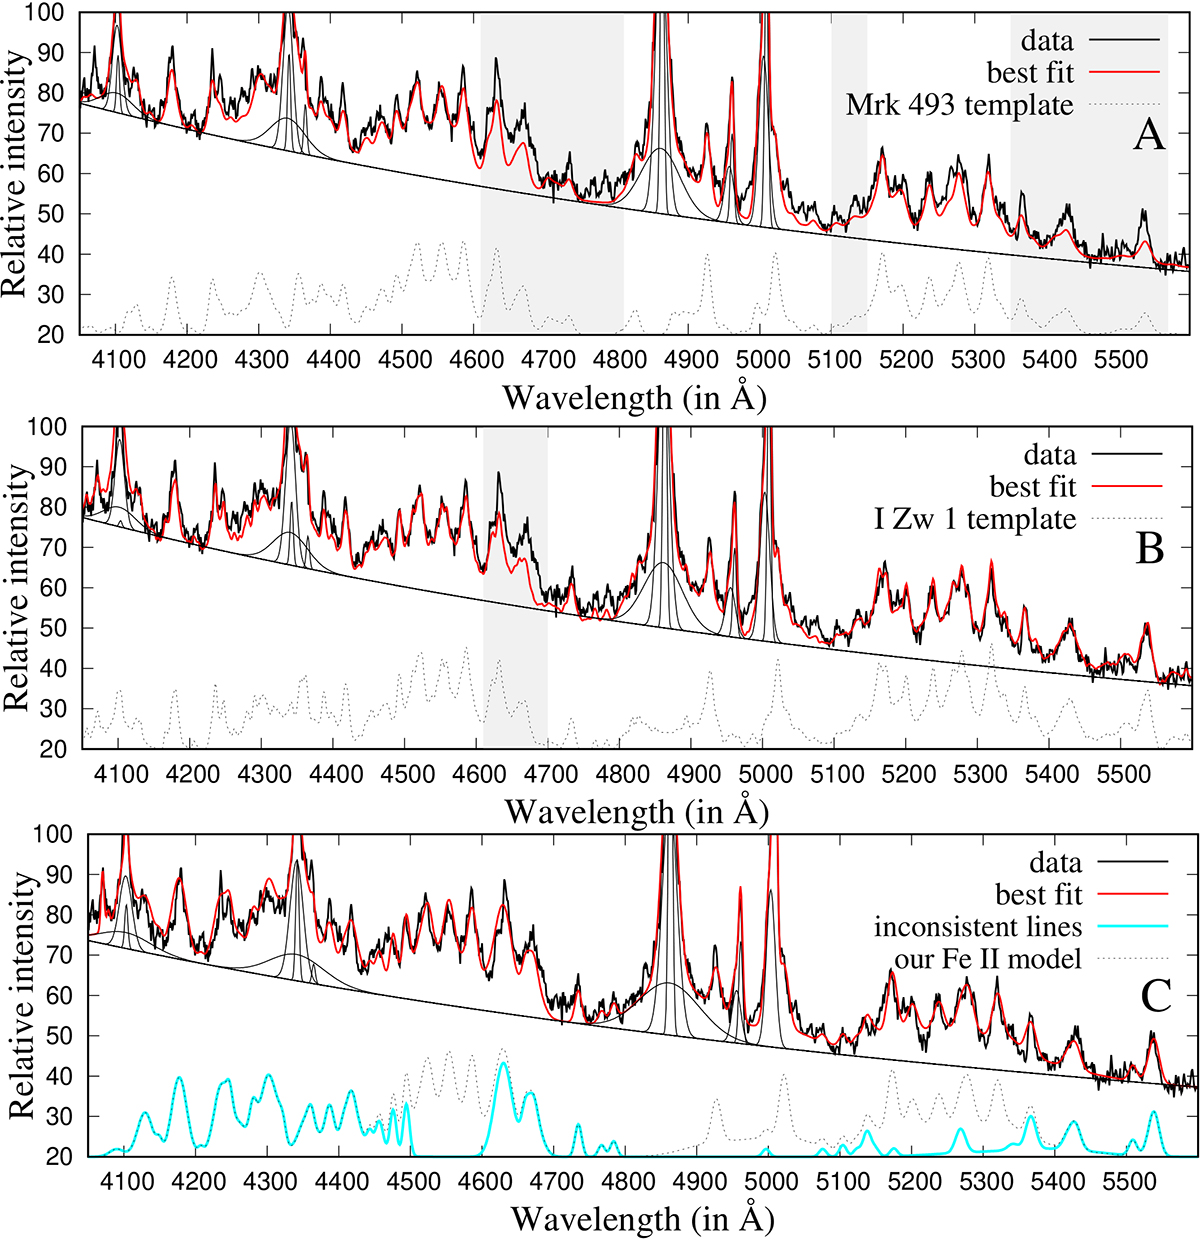
Fig. C.1.
Download original image
Example of the fit of the spectrum with narrow Fe II lines (SDSS J121549.43+544223.9, plate-mjd-fiber: 8214-57867-0390) with a template made from Mrk 493 given in Park et al. (2022) (see panel A) and with a template made from the I Zw 1 spectrum given in Boroson & Green (1992) (panel B). The shaded regions in panels A and B highlight the mismatch between the fit and data. In panel C we fit the object with our complex Fe II model which assume multiple line groups (F, S and G for consistent and P+, G+, H and OL for inconsistent Fe II lines). Sum of all Fe II lines obtained from best fit with our model is denoted with dashed line, and sum of only inconsistent lines is denoted with cyan.
Current usage metrics show cumulative count of Article Views (full-text article views including HTML views, PDF and ePub downloads, according to the available data) and Abstracts Views on Vision4Press platform.
Data correspond to usage on the plateform after 2015. The current usage metrics is available 48-96 hours after online publication and is updated daily on week days.
Initial download of the metrics may take a while.