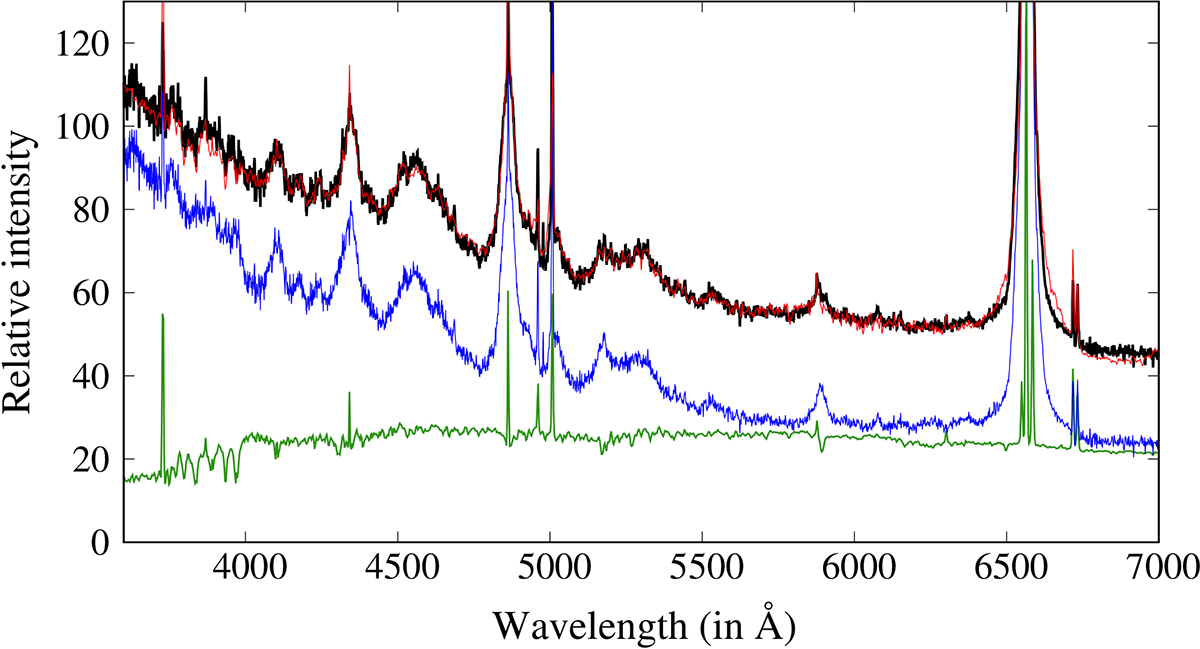
Fig. 1.
Download original image
Example of the decomposition of the spectrum (SDSS J105355.69+661202.2) to the host galaxy and the pure AGN contribution using spectral PCA. The black line is the original spectrum, and the red line is the best fit obtained with a linear combination of 15 eigenspectra. The green line is the reconstructed host galaxy contribution, and the blue line is the pure AGN contribution (host contribution subtracted from the observed spectrum).
Current usage metrics show cumulative count of Article Views (full-text article views including HTML views, PDF and ePub downloads, according to the available data) and Abstracts Views on Vision4Press platform.
Data correspond to usage on the plateform after 2015. The current usage metrics is available 48-96 hours after online publication and is updated daily on week days.
Initial download of the metrics may take a while.