Open Access
Fig. D.1.
Download original image
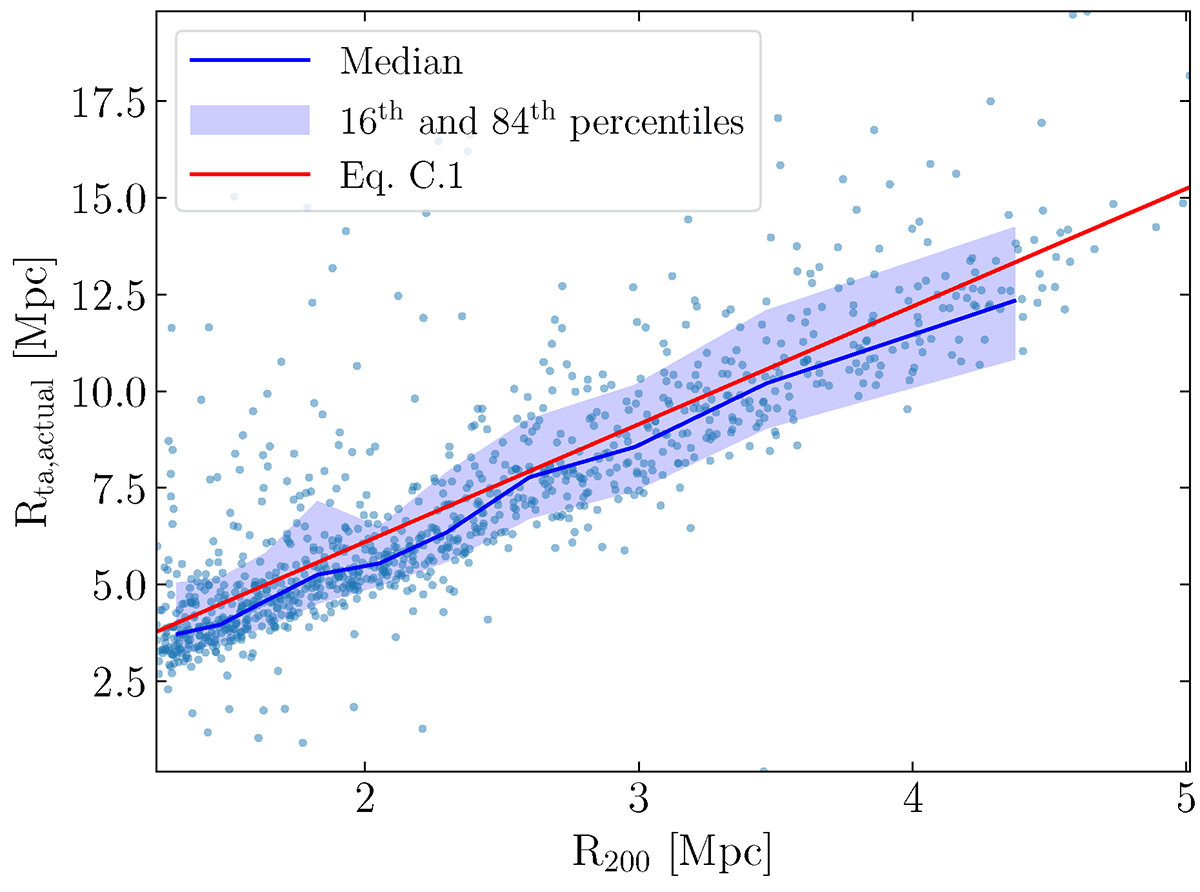
Correlation between the true turnaround radius Rta,actual and R200 for our cluster sample at z = 0. The red solid line depicts the theoretical scaling relation of Eq. D.1. The blue solid line represents the median value of the blue points in bins of R200. The blue shaded region corresponds to the 16th and 84th percentiles.
Current usage metrics show cumulative count of Article Views (full-text article views including HTML views, PDF and ePub downloads, according to the available data) and Abstracts Views on Vision4Press platform.
Data correspond to usage on the plateform after 2015. The current usage metrics is available 48-96 hours after online publication and is updated daily on week days.
Initial download of the metrics may take a while.