Open Access
Fig. B.2.
Download original image
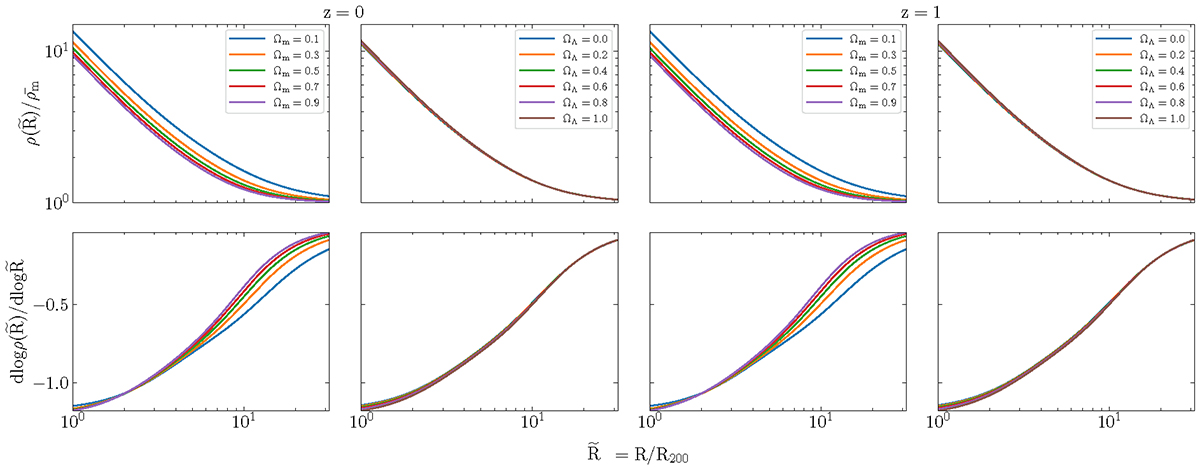
Analytical profile dependencies on the cosmological parameters at different redshifts. As in Fig. 3, different panels show the change of the density profile and its logarithmic slope with the difference that in this figure the radii have been normalized with respect to R200.
Current usage metrics show cumulative count of Article Views (full-text article views including HTML views, PDF and ePub downloads, according to the available data) and Abstracts Views on Vision4Press platform.
Data correspond to usage on the plateform after 2015. The current usage metrics is available 48-96 hours after online publication and is updated daily on week days.
Initial download of the metrics may take a while.