Fig. 2.
Download original image
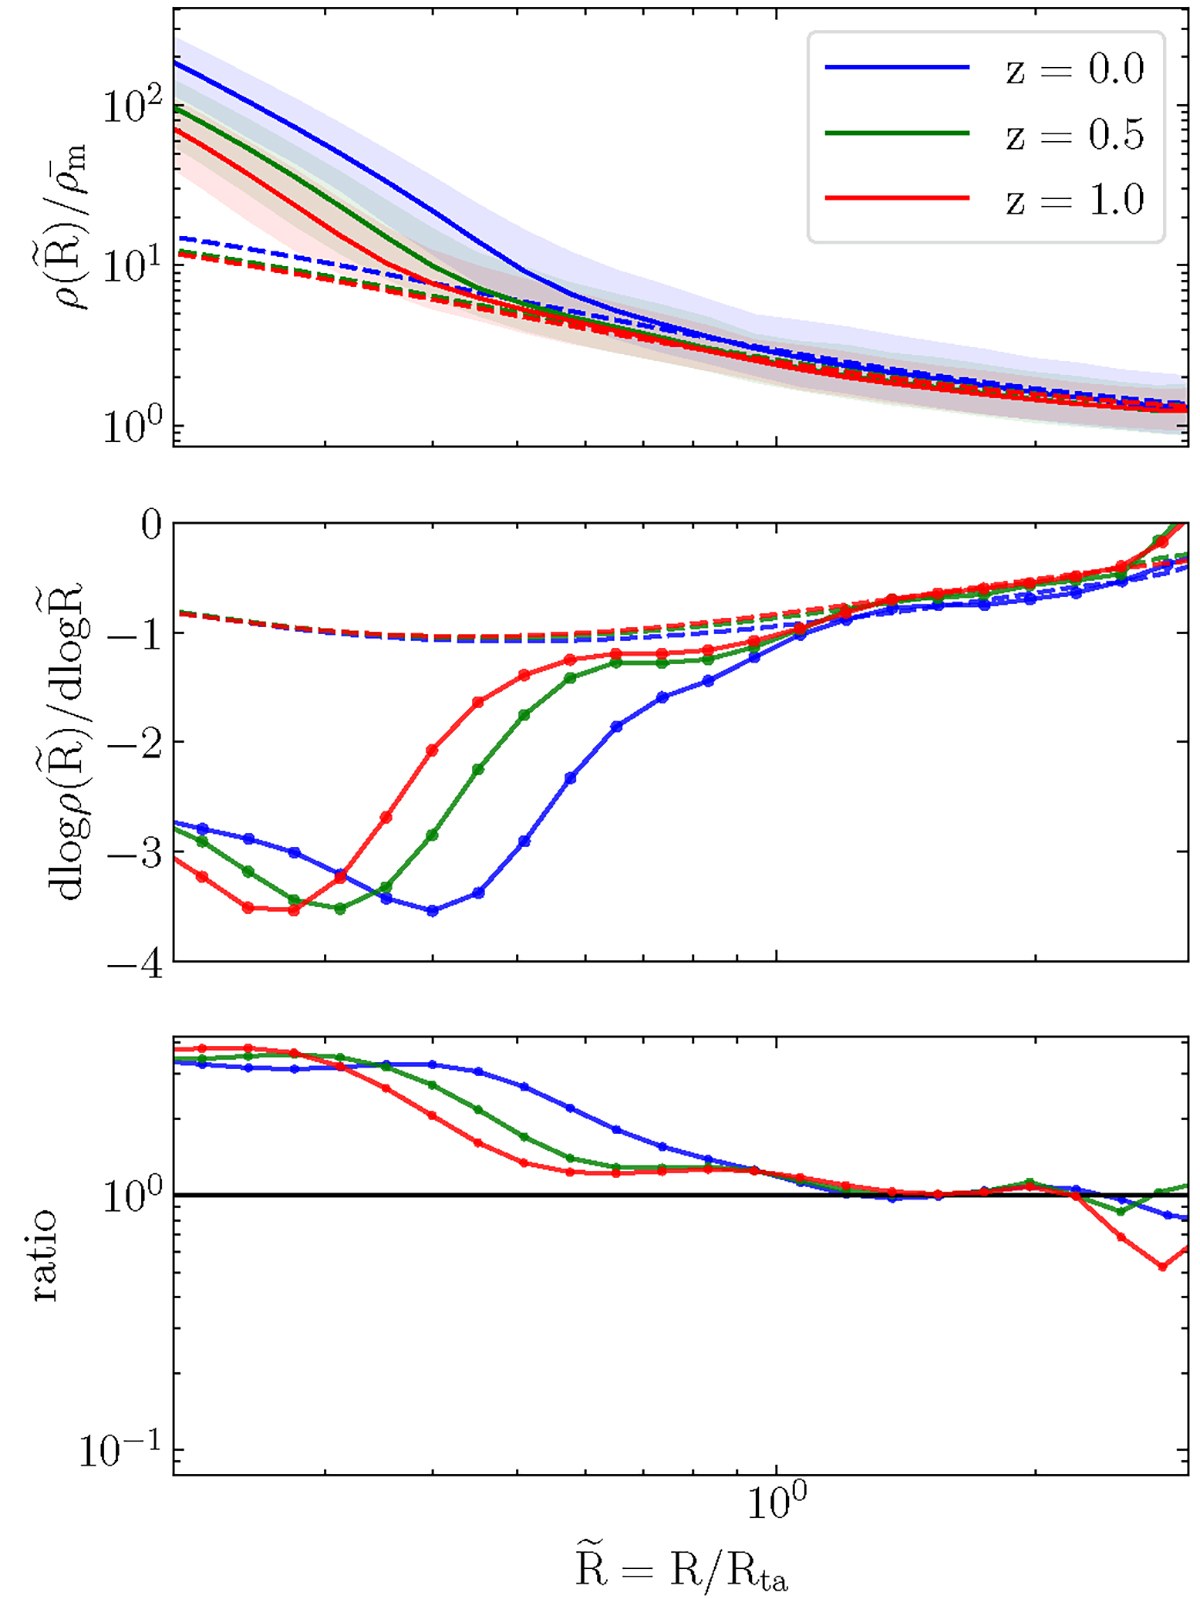
Comparison between simulated and analytic density profiles for different redshifts. Upper panel: solid lines depict the median density profile at different redshifts of our MDPL2 sample in spherical shells of radius R/Rta; shaded regions represent the 1σ spread of the density within each shell; dashed lines represent the analytical prediction for the outer portions of the mode profile discussed in Sect. 3. Middle panel: Logarithmic slope of the density profiles, with dashed lines illustrating the logarithmic slope of the analytical prediction. Lower panel: ratio of logarithmic slope in median simulated profile over the one of the analytically predicted profile. The analytic slope deviates from the one in simulations for R/Rta ≲ 1.
Current usage metrics show cumulative count of Article Views (full-text article views including HTML views, PDF and ePub downloads, according to the available data) and Abstracts Views on Vision4Press platform.
Data correspond to usage on the plateform after 2015. The current usage metrics is available 48-96 hours after online publication and is updated daily on week days.
Initial download of the metrics may take a while.