Open Access
Fig. 7.
Download original image
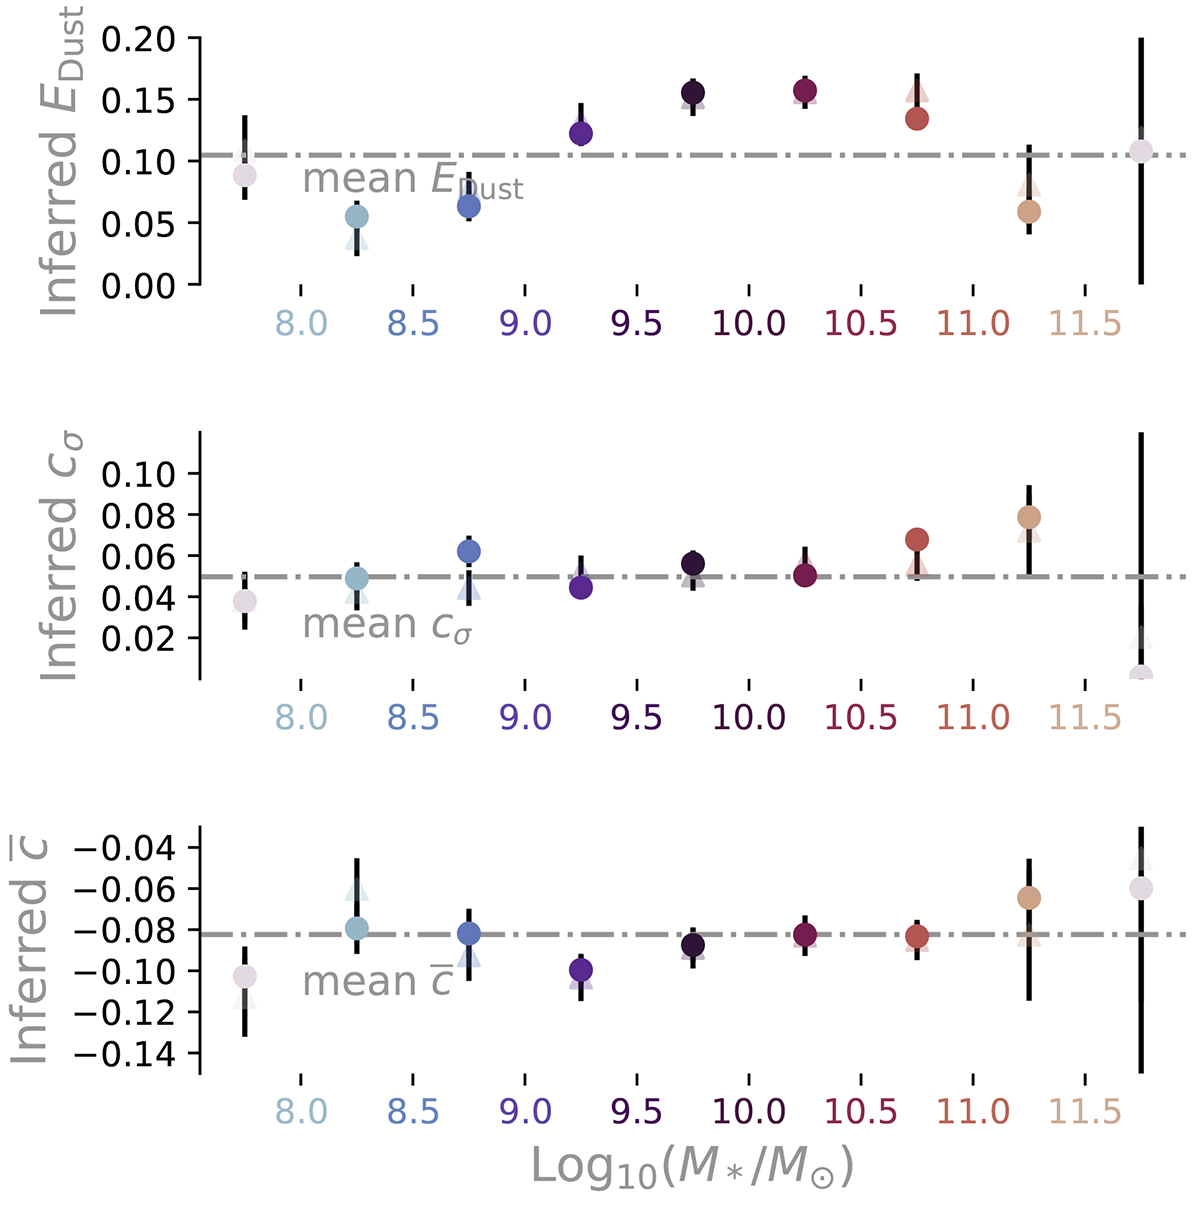
Fit parameters for the Gaussian and exponential distributions plotted with increasing host galaxy mass. Alongside each parameter, the mean fit values is plotted in dash-dotted line to provide context. The fit results from the conservative sample are overlaid with triangles for comparison. See Sect. 4.2 for more details.
Current usage metrics show cumulative count of Article Views (full-text article views including HTML views, PDF and ePub downloads, according to the available data) and Abstracts Views on Vision4Press platform.
Data correspond to usage on the plateform after 2015. The current usage metrics is available 48-96 hours after online publication and is updated daily on week days.
Initial download of the metrics may take a while.