Fig. 5.
Download original image
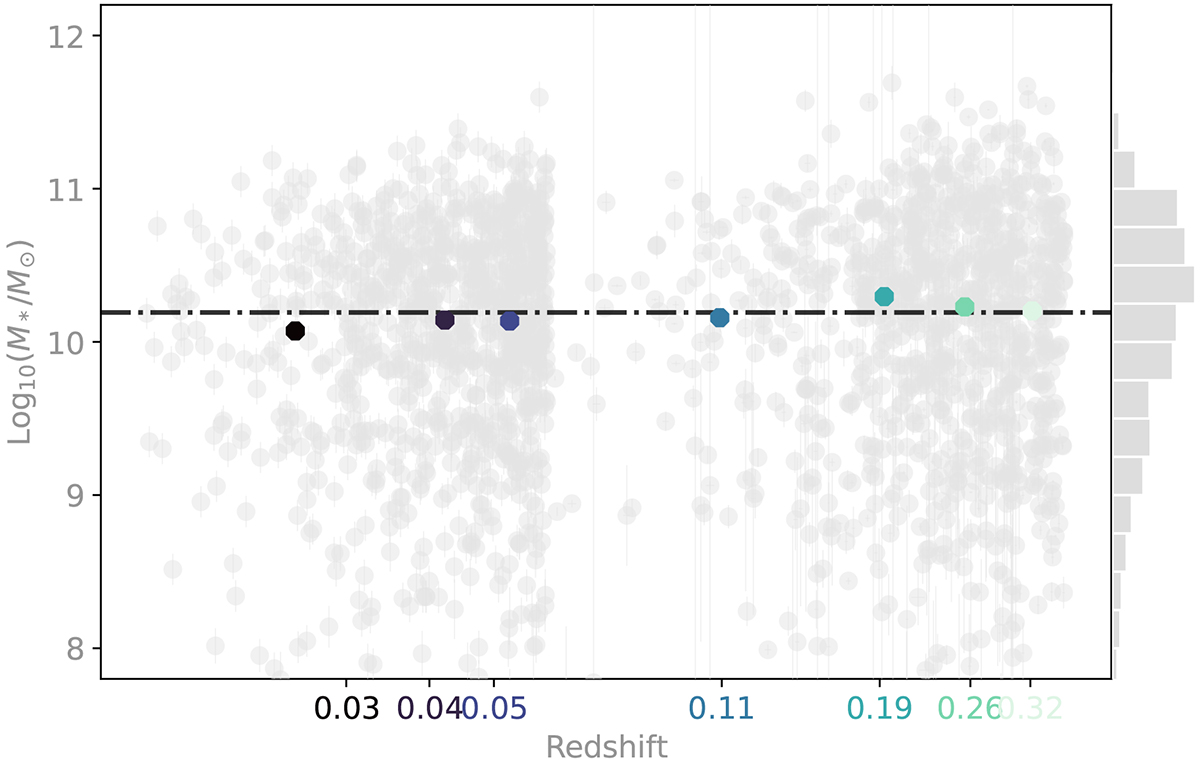
Host galaxy mass plotted vs redshift for the Fiducial sample. Supernovae are shown in grey, the coloured circles represent the median host galaxy mass in each quantile redshift bin. The dash-dotted black line shows the median host galaxy mass of the entire sample. The mass distribution, marginalised over redshift, is shown on the right. See Sect. 4.2 for more details.
Current usage metrics show cumulative count of Article Views (full-text article views including HTML views, PDF and ePub downloads, according to the available data) and Abstracts Views on Vision4Press platform.
Data correspond to usage on the plateform after 2015. The current usage metrics is available 48-96 hours after online publication and is updated daily on week days.
Initial download of the metrics may take a while.