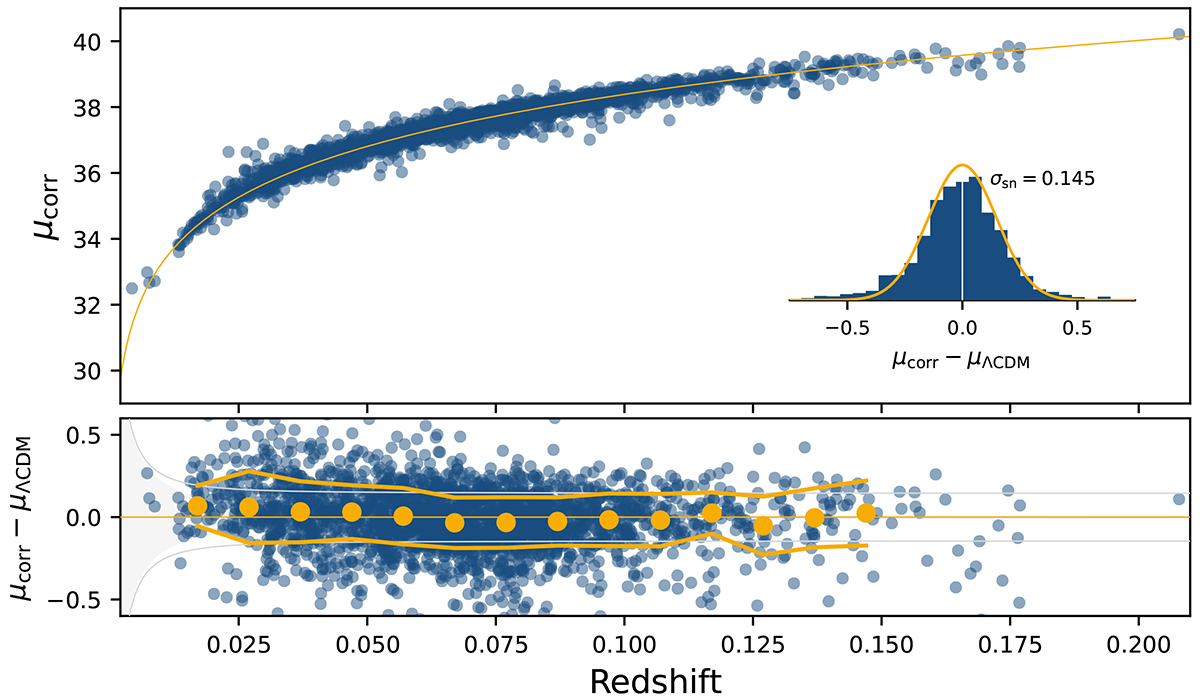
Fig. 6.
Download original image
ZTF SN Ia DR2 Hubble diagram. Top: Hubble diagram of the 2629 standardized non-peculiar SNe Ia compared to the ΛCDM model anchored on (Planck Collaboration VI 2020) with an arbitrary zero-point offset. Bottom: Standardized Hubble residuals. Orange markers (lines) show the median (±nmad) data per bin of redshifts (Δz = 0.01). The light gray band shows the expected scatter caused by peculiar velocities of 300 km s−1, while gray lines present the expected total scatter, adding in quadrature a 0.145 mag scatter (see text). Inset panel: Standardized Hubble residual distribution (blue) with a normal distribution centered on zero with a scatter of 0.145 mag, adding in quadrature a velocity dispersion (0.149 mag).
Current usage metrics show cumulative count of Article Views (full-text article views including HTML views, PDF and ePub downloads, according to the available data) and Abstracts Views on Vision4Press platform.
Data correspond to usage on the plateform after 2015. The current usage metrics is available 48-96 hours after online publication and is updated daily on week days.
Initial download of the metrics may take a while.