Fig. 5.
Download original image
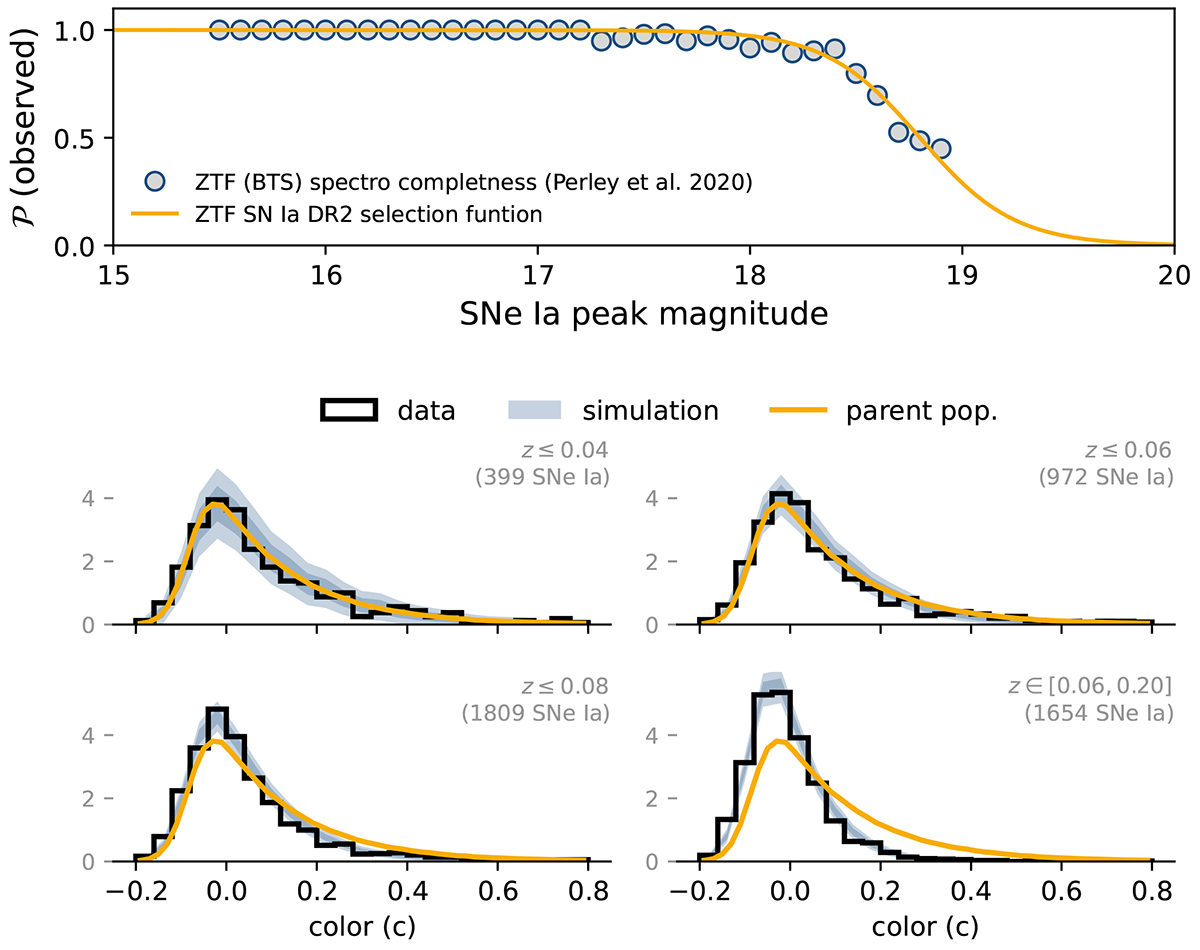
Selection function of the ZTF SN Ia DR2 sample and its effect on the color distribution. Top: Probability that a SN Ia spectrum is acquired and leads to a classification as a function of SN Ia peak magnitude. The model is the survival sigmoid function 1 − 𝒮(18.8, 4.5). Bottom: Distribution of the ZTF SN Ia DR2 color (black) compared to the expected parent population (orange) and simulation predictions (1 and 2σ, light blue) for various redshift ranges (see legend).
Current usage metrics show cumulative count of Article Views (full-text article views including HTML views, PDF and ePub downloads, according to the available data) and Abstracts Views on Vision4Press platform.
Data correspond to usage on the plateform after 2015. The current usage metrics is available 48-96 hours after online publication and is updated daily on week days.
Initial download of the metrics may take a while.