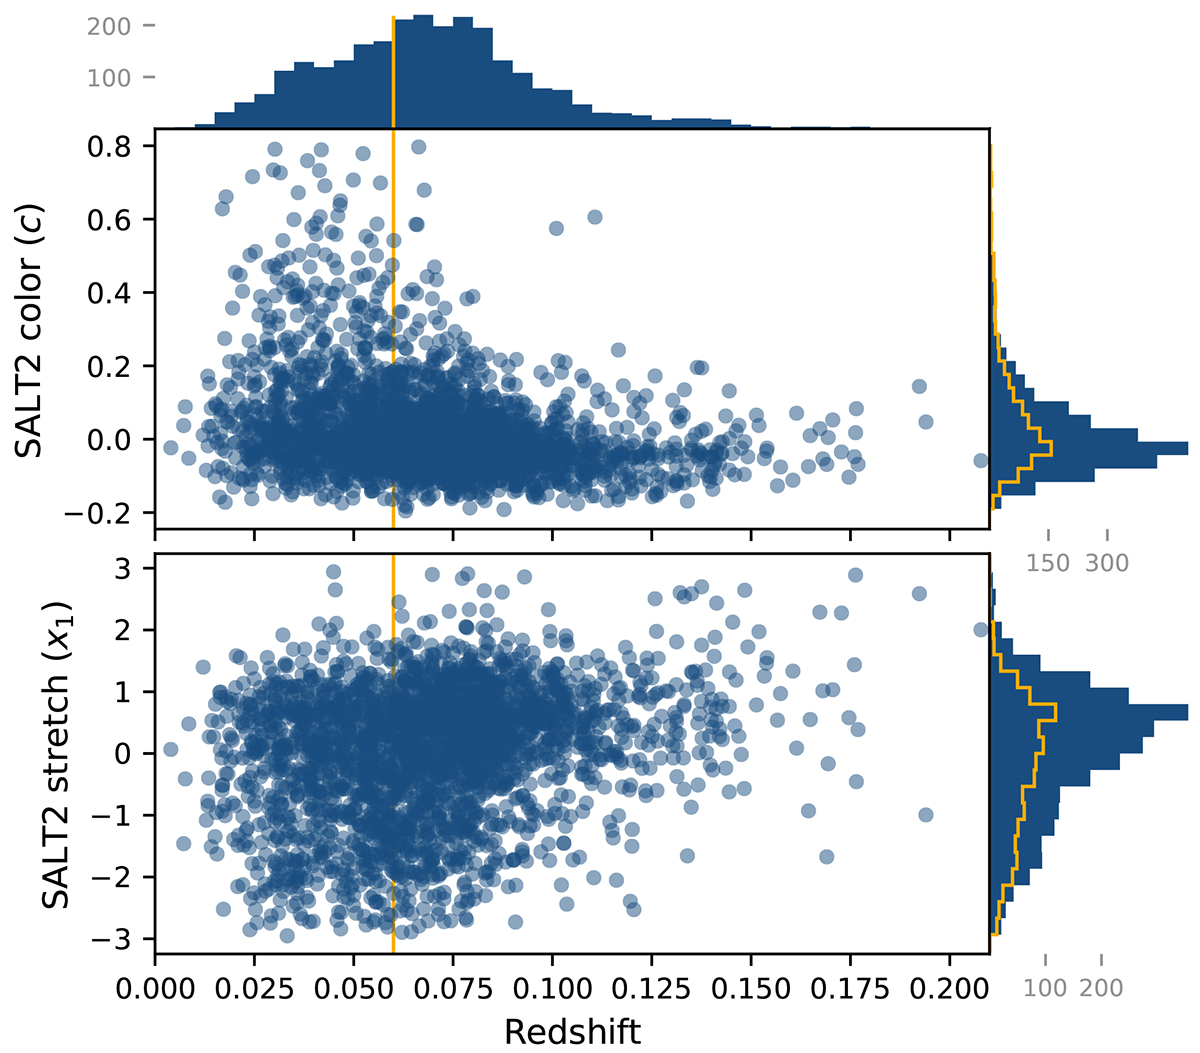
Fig. 4.
Download original image
Distribution of SALT2 stretch (x1) and color (c) parameters as a function of redshift for the 2667 SNe Ia passing the basic quality cuts detailed in Table 1. The vertical yellow lines illustrate the redshift below which the DR2 sample can be considered volume-limited (z < 0.06) for normal SNe Ia. The corresponding volume-limited parameter distributions are shown in yellow in the marginalized histograms.
Current usage metrics show cumulative count of Article Views (full-text article views including HTML views, PDF and ePub downloads, according to the available data) and Abstracts Views on Vision4Press platform.
Data correspond to usage on the plateform after 2015. The current usage metrics is available 48-96 hours after online publication and is updated daily on week days.
Initial download of the metrics may take a while.