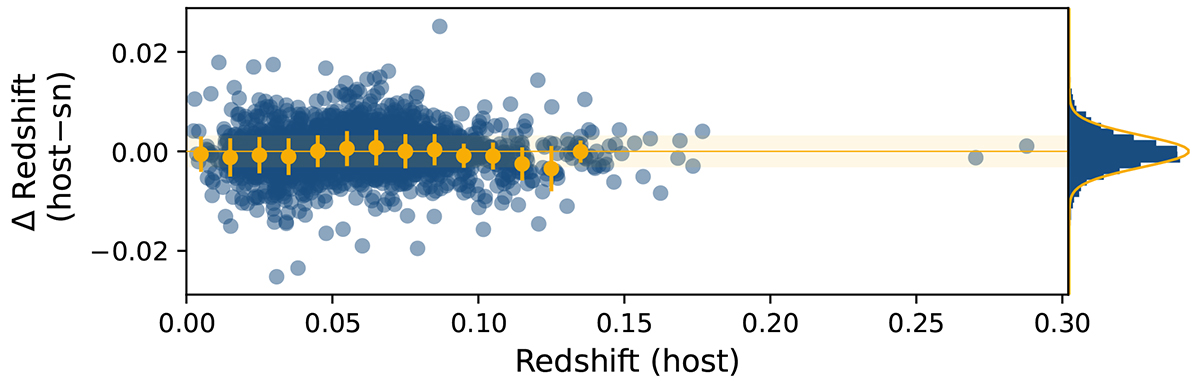
Fig. 3.
Download original image
Comparison between the host redshift (mostly from DESI) and SN-feature-based redshifts. Orange markers represent the median and nmad (error bar) per bins of δz = 0.01 redshift. The horizontal orange line shows “zero”, while the orange band shows the ±3 × 10⁻³ range. The right-panel histogram shows the Δz distribution overplotted (orange) with a normal distribution, 𝒩(0, 3 × 10⁻³).
Current usage metrics show cumulative count of Article Views (full-text article views including HTML views, PDF and ePub downloads, according to the available data) and Abstracts Views on Vision4Press platform.
Data correspond to usage on the plateform after 2015. The current usage metrics is available 48-96 hours after online publication and is updated daily on week days.
Initial download of the metrics may take a while.