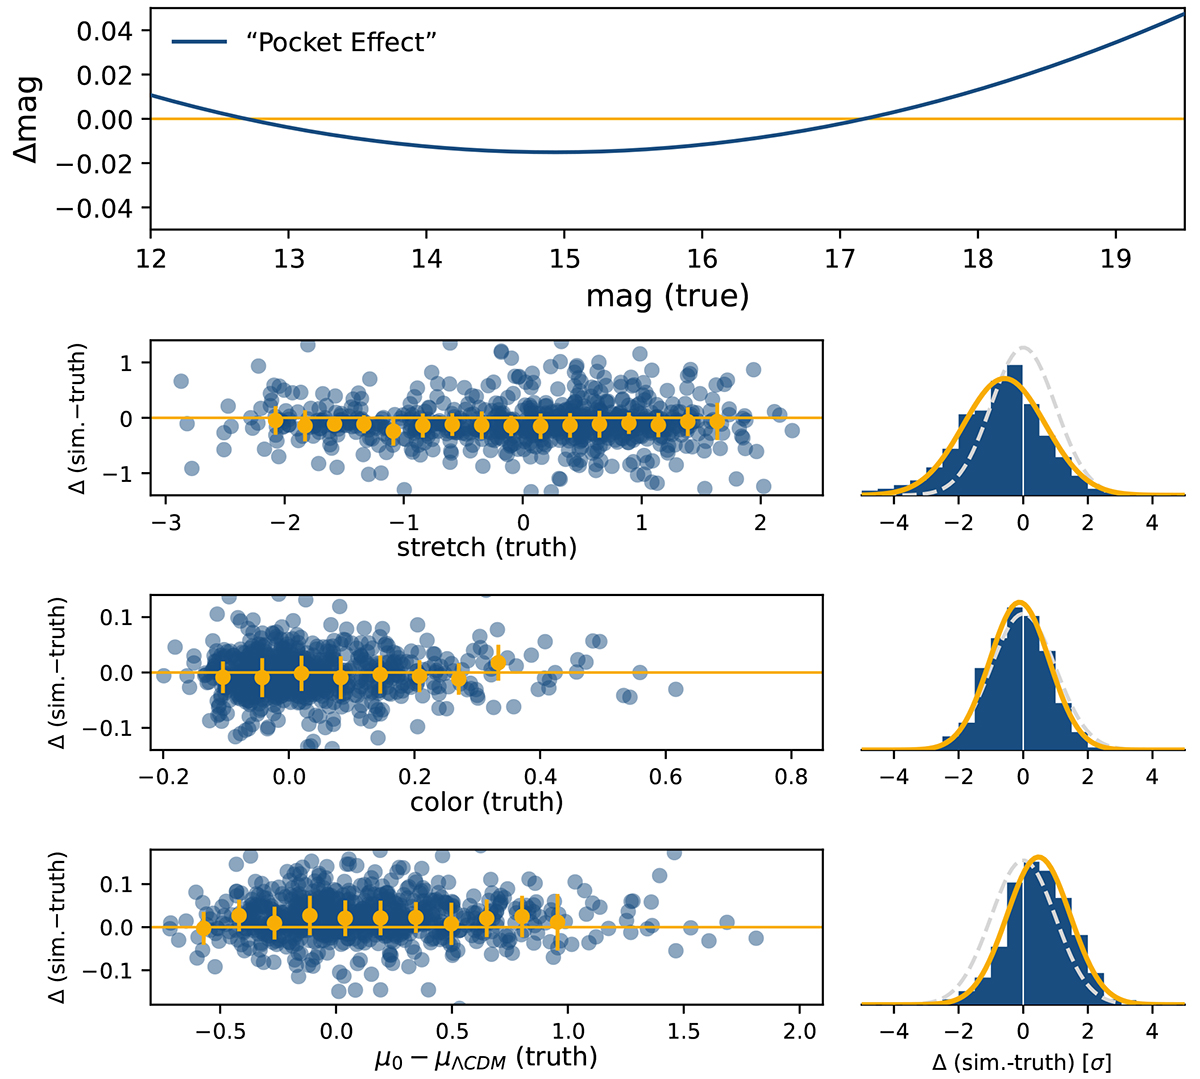
Fig. 2.
Download original image
Impact of the pocket effect photometric nonlinearity affecting ZTF data since November 2019. Top panel: Magnitude bias caused by the pocket effect (model) as a function of (input) magnitude. Lower panels: Difference between SN Ia parameters recovered from realistic light curve simulations affected by the pocket effect as a function of the input parameter (truth). Top to bottom: SN Ia peak magnitude in b band (from x0), the SN Ia stretch, color, and Hubble residual (non-standardized). Orange markers (errors) show the median (nmad) difference per bin of input parameters. The horizontal orange lines show zero. The histograms on the right display parameter pulls ((sim.-truth) or error), which should follow a 𝒩(0, 1) distribution (dashed gray). Best fit normal distributions on pulls are shown in orange. In the mb panel, the top gray ticks show the redshift corresponding to the peak magnitude of a typical MB = −19.3 SN Ia.
Current usage metrics show cumulative count of Article Views (full-text article views including HTML views, PDF and ePub downloads, according to the available data) and Abstracts Views on Vision4Press platform.
Data correspond to usage on the plateform after 2015. The current usage metrics is available 48-96 hours after online publication and is updated daily on week days.
Initial download of the metrics may take a while.