Fig. 1.
Download original image
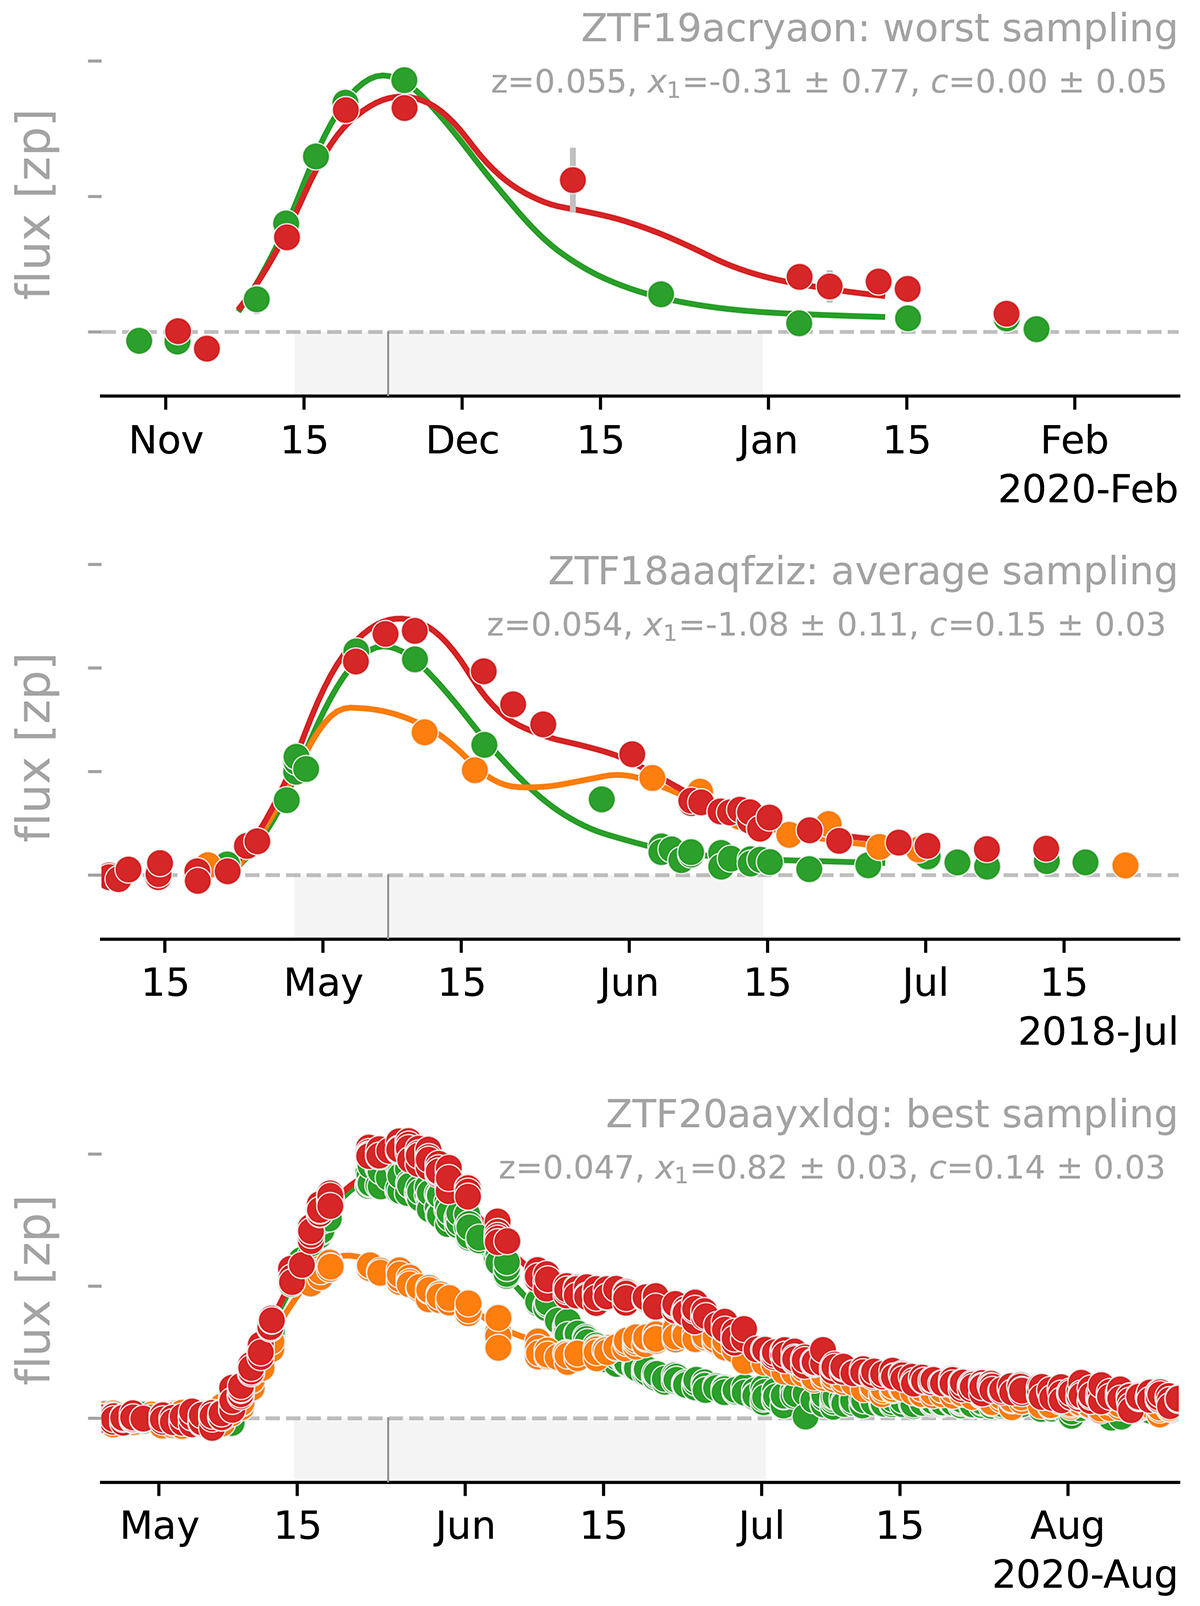
Three SN Ia light curve examples illustrating, from top to bottom, the worst, average, and best sampling of DR2. Photometric points observed with the g, r, and i bands are shown as green, red, and orange markers, respectively. Lines show the best fit SALT2 model with matching colors, and the associated parameters in the legend. The lower gray bands show the ϕ ∈ [ − 10, +40] rest-frame phase range used to fit the SALT model. The vertical lines indicate the estimated maximum light.
Current usage metrics show cumulative count of Article Views (full-text article views including HTML views, PDF and ePub downloads, according to the available data) and Abstracts Views on Vision4Press platform.
Data correspond to usage on the plateform after 2015. The current usage metrics is available 48-96 hours after online publication and is updated daily on week days.
Initial download of the metrics may take a while.