Fig. 8
Download original image
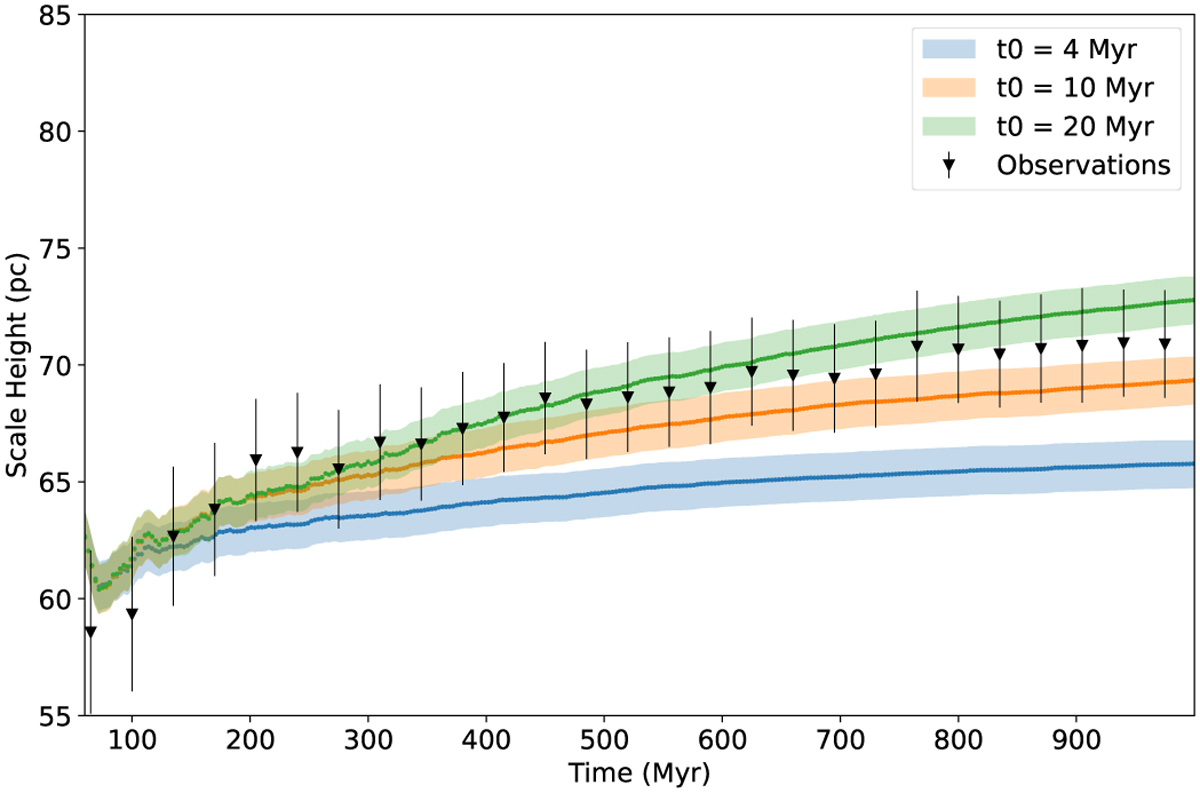
Comparison of the SH evolution for runs with different values of t0 (BSH = 92 pc, p0 = 0.004, and DSH = 30 pc). The curves correspond to the averages of ten independent runs and the shaded regions are the standard deviations. The black triangles are the mean SH obtained from 1000 bootstrap runs on the observational sample and the error bars are the standard deviations.
Current usage metrics show cumulative count of Article Views (full-text article views including HTML views, PDF and ePub downloads, according to the available data) and Abstracts Views on Vision4Press platform.
Data correspond to usage on the plateform after 2015. The current usage metrics is available 48-96 hours after online publication and is updated daily on week days.
Initial download of the metrics may take a while.