Fig. 6
Download original image
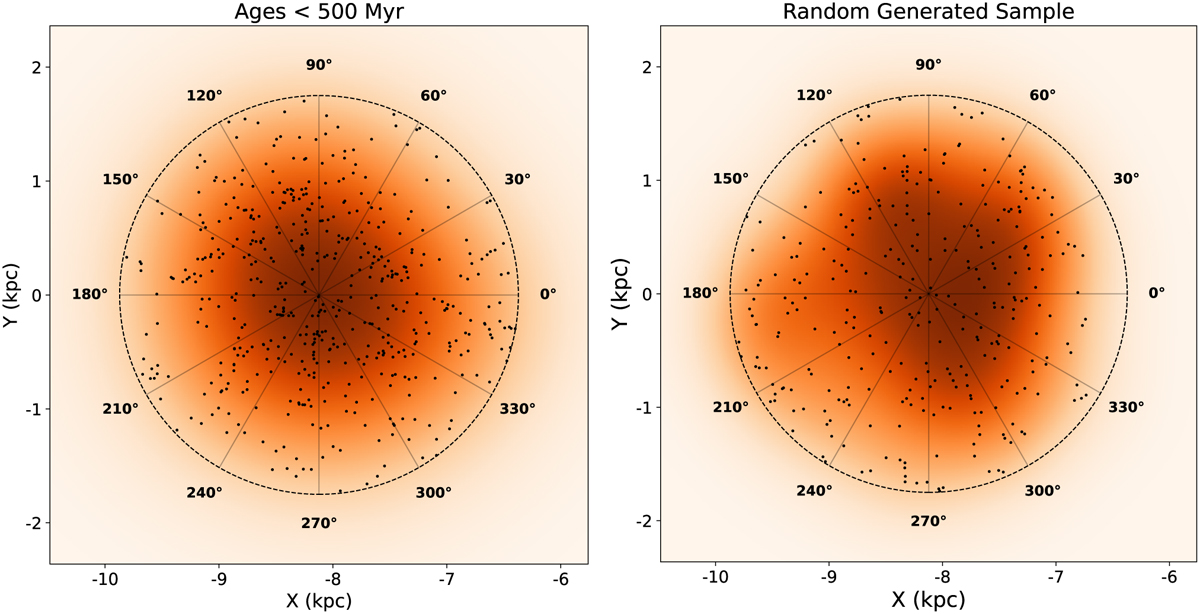
Observed spatial distribution of OCs and comparison with a randomly generated sample. Left: spatial distribution of OCs projected onto the GP, for OCs ages <500 Myr and R⊙ < 1.75 kpc. Right: example of a random generated spatial distribution of OCs. Both plots include KDEs for a better comparison of the decrease in the number density with heliocentric distance.
Current usage metrics show cumulative count of Article Views (full-text article views including HTML views, PDF and ePub downloads, according to the available data) and Abstracts Views on Vision4Press platform.
Data correspond to usage on the plateform after 2015. The current usage metrics is available 48-96 hours after online publication and is updated daily on week days.
Initial download of the metrics may take a while.