Open Access
Fig. 4
Download original image
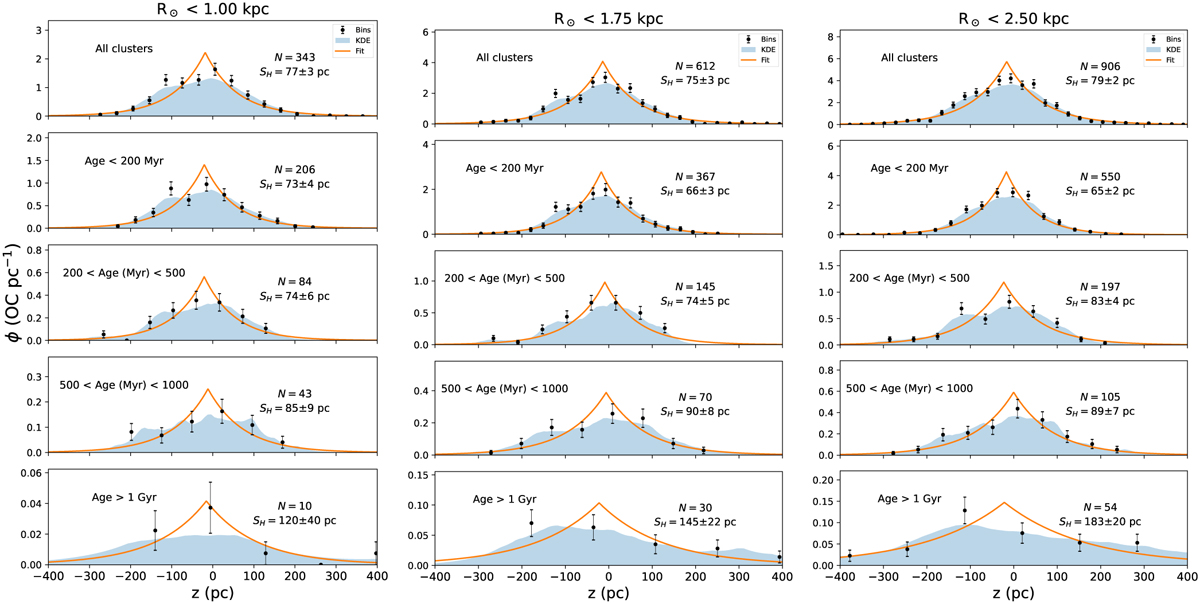
Vertical distribution of the OCs catalogued in (Dias et al. 2021) on the GP for different age groups and for the considered cylindrical cuts. The filled curve represents a KDE using an exponential kernel and the solid lines represent maximum likelihood estimations of Laplace profiles (see Sect. 2.4 for details).
Current usage metrics show cumulative count of Article Views (full-text article views including HTML views, PDF and ePub downloads, according to the available data) and Abstracts Views on Vision4Press platform.
Data correspond to usage on the plateform after 2015. The current usage metrics is available 48-96 hours after online publication and is updated daily on week days.
Initial download of the metrics may take a while.