Fig. 12
Download original image
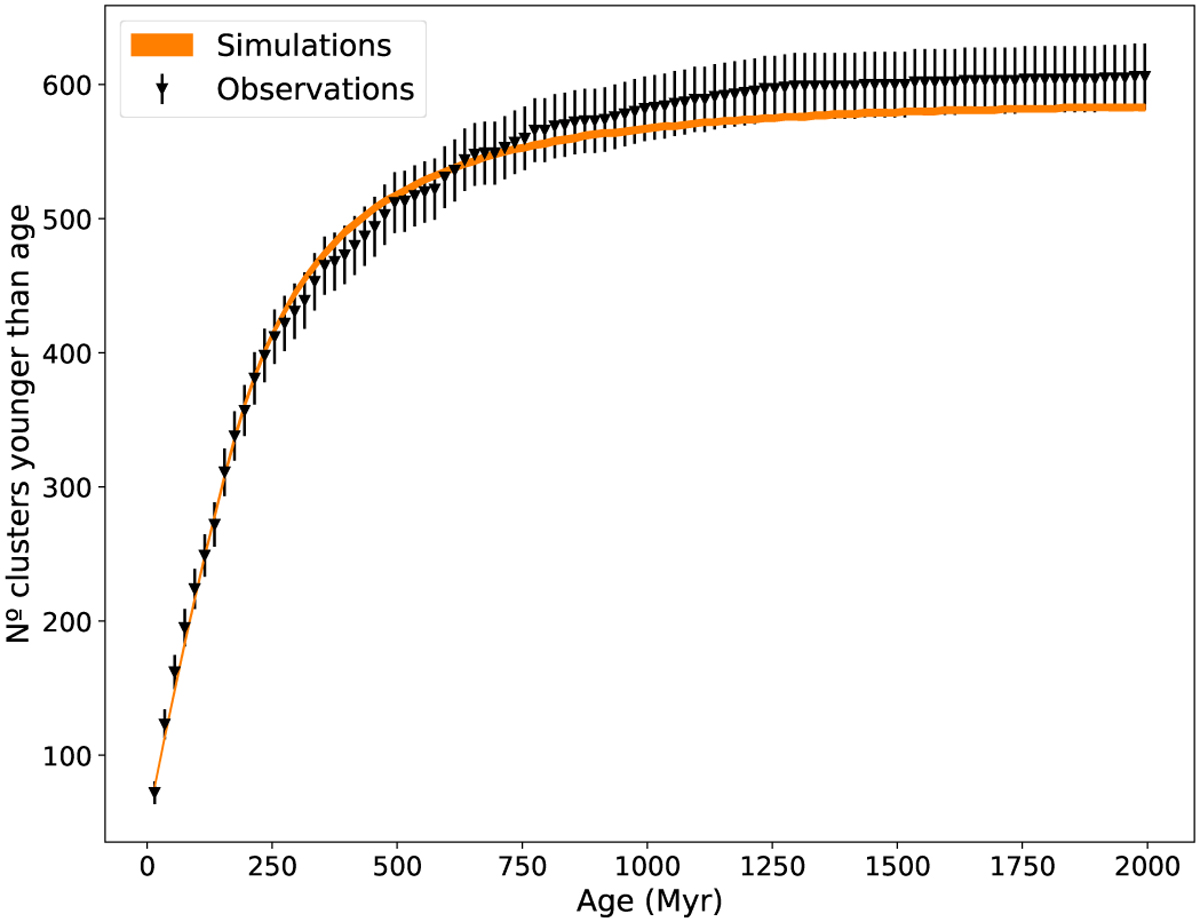
Comparison of the evolution of the total number of OCs younger than time using BSH = 92 pc, DSH = 50 pc, p0 = 0.004, and t0 = 11 Myr. The error bars of the observations correspond to 1σ Poisson errors. The values presented for the simulations are the average number observed in the ten independent runs and the thickness of the curve is given by the standard deviations.
Current usage metrics show cumulative count of Article Views (full-text article views including HTML views, PDF and ePub downloads, according to the available data) and Abstracts Views on Vision4Press platform.
Data correspond to usage on the plateform after 2015. The current usage metrics is available 48-96 hours after online publication and is updated daily on week days.
Initial download of the metrics may take a while.