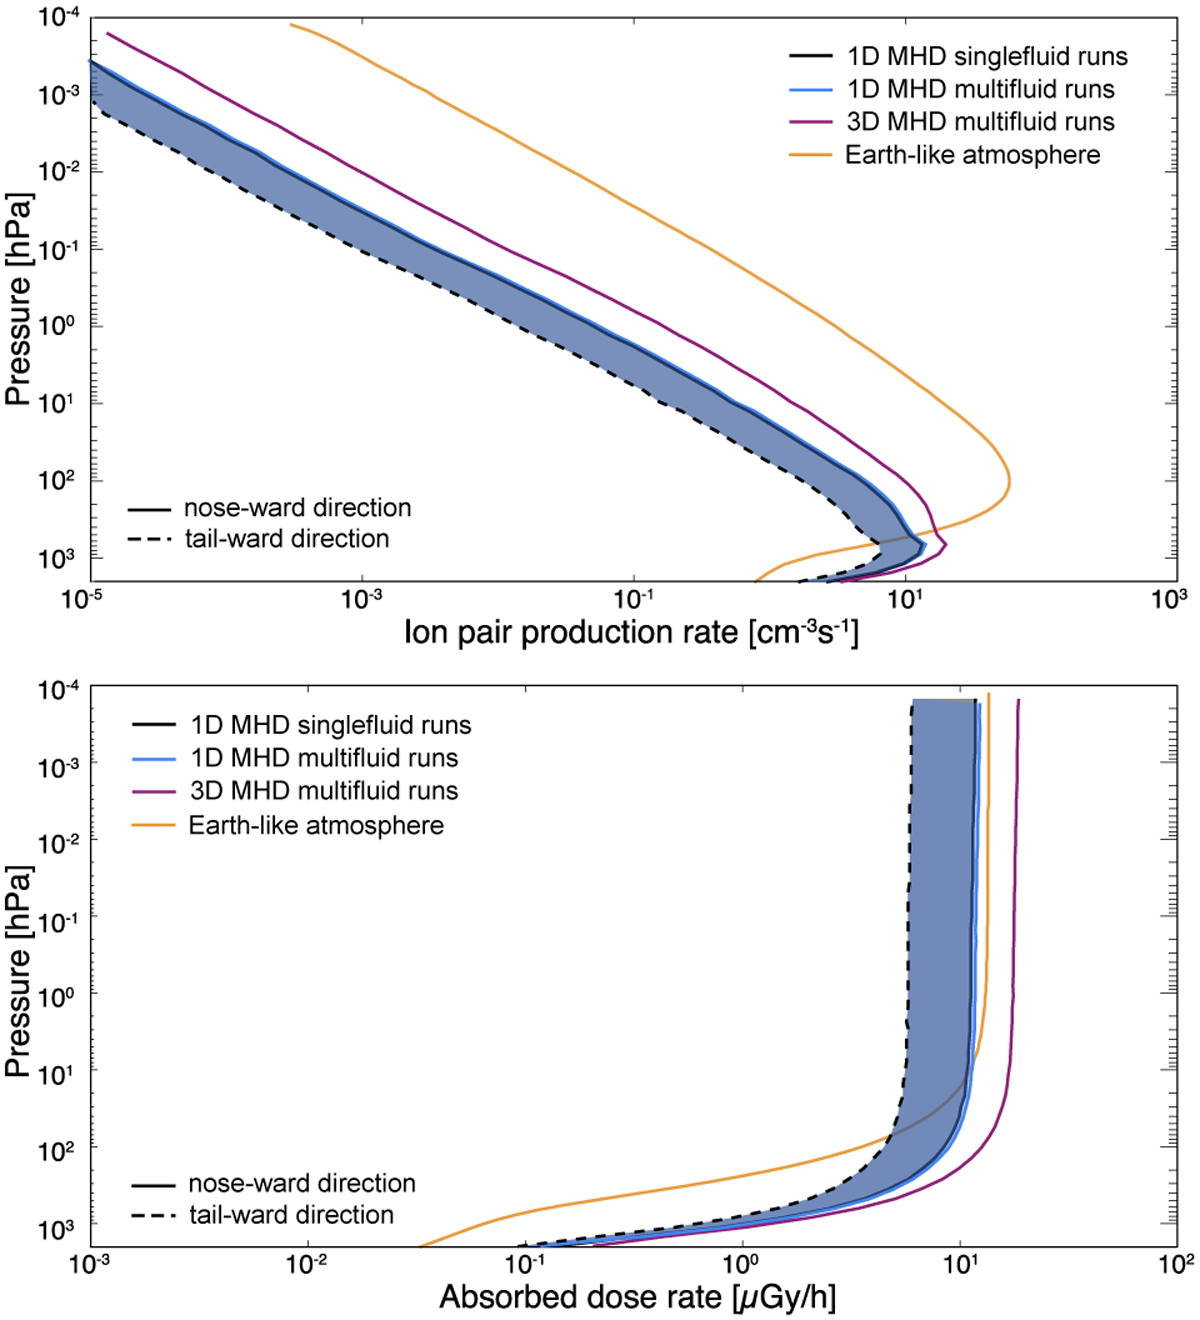
Fig. 6
Download original image
GCR ionization rates and absorbed dose rates. Upper panel: GCR-induced atmospheric ionization of LHS 1140 b based on the 1D single- and multi-fluid runs (in black and blue, respectively) in noseward (solid lines) and tailward (dashed lines) direction. The results utilizing the 3D GCR fluxes are shown in purple. In comparison, the results for an Earth-like atmosphere of TRAPPIST-1e (e.g., Herbst et al. 2024) are highlighted in orange. Lower panel: GCR-induced absorbed dose rates. Colors and line styles according to the upper panel.
Current usage metrics show cumulative count of Article Views (full-text article views including HTML views, PDF and ePub downloads, according to the available data) and Abstracts Views on Vision4Press platform.
Data correspond to usage on the plateform after 2015. The current usage metrics is available 48-96 hours after online publication and is updated daily on week days.
Initial download of the metrics may take a while.