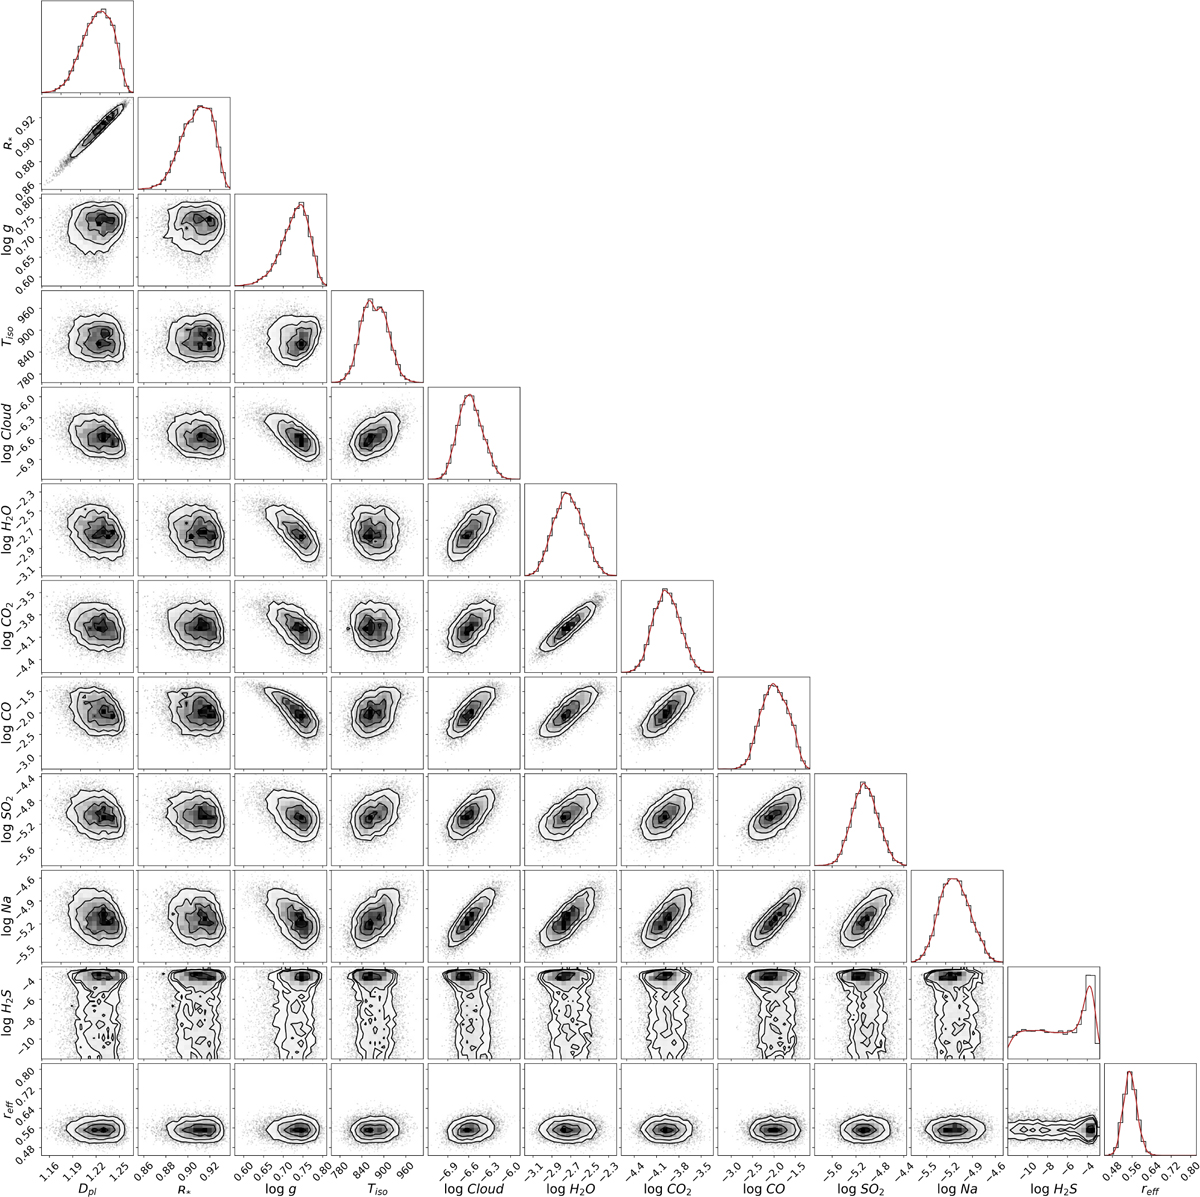
Fig. A.2
Download original image
Corner plot of the retrieval using the MOPSMAP cloud extinction model (model IV). The top plots for each column are the marginalised probability distributions for the different free parameters of the retrieval. The red lines are the fits of those distributions to a Gaussian function and the vertical dashed lines are the median and the 1 σ deviations. The rest of plots present the marginalised probability distributions as a function of a pair of parameters. The parameters are represented in the units shown in Table 5. Dpl, however, is represented in units of Jovian diameters.
Current usage metrics show cumulative count of Article Views (full-text article views including HTML views, PDF and ePub downloads, according to the available data) and Abstracts Views on Vision4Press platform.
Data correspond to usage on the plateform after 2015. The current usage metrics is available 48-96 hours after online publication and is updated daily on week days.
Initial download of the metrics may take a while.