Open Access
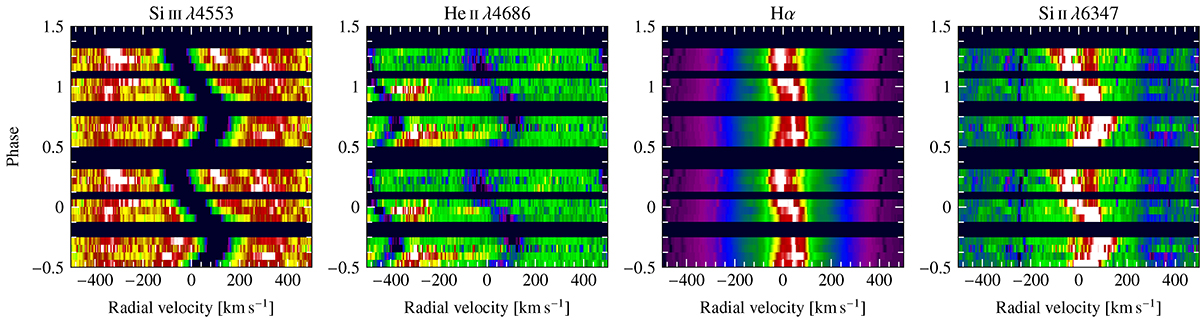
Fig. 5.
Download original image
ARCES spectra of V447 Sct folded with the orbital period for selected lines, as labeled. Similar to V742 Cas shown in Fig. 2, except for the single peaked emission in Si II, which is something also seen in HR 6819 (Rivinius et al. 2020).
Current usage metrics show cumulative count of Article Views (full-text article views including HTML views, PDF and ePub downloads, according to the available data) and Abstracts Views on Vision4Press platform.
Data correspond to usage on the plateform after 2015. The current usage metrics is available 48-96 hours after online publication and is updated daily on week days.
Initial download of the metrics may take a while.