Fig. 9.
Download original image
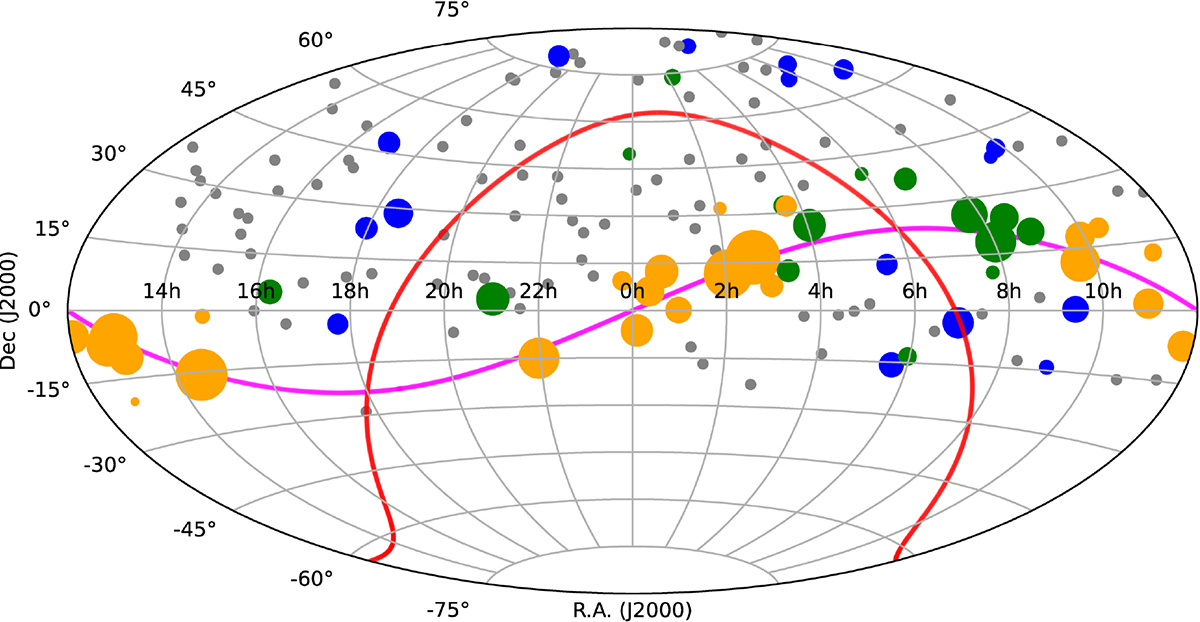
Visual inspection of sources. The distribution in the sky of type I (orange dots), type IIa (green dots), type IIb (blue dots), and unaffected sources (grey dots). The size of the dots is proportional to the ratio between the 2 GHz dropout at minimum solar elongation and the average 2 GHz flux density (Col. 8 and 4, respectively, in Table 3). The magenta line shows the ecliptic, while the red one shows the galactic plane.
Current usage metrics show cumulative count of Article Views (full-text article views including HTML views, PDF and ePub downloads, according to the available data) and Abstracts Views on Vision4Press platform.
Data correspond to usage on the plateform after 2015. The current usage metrics is available 48-96 hours after online publication and is updated daily on week days.
Initial download of the metrics may take a while.