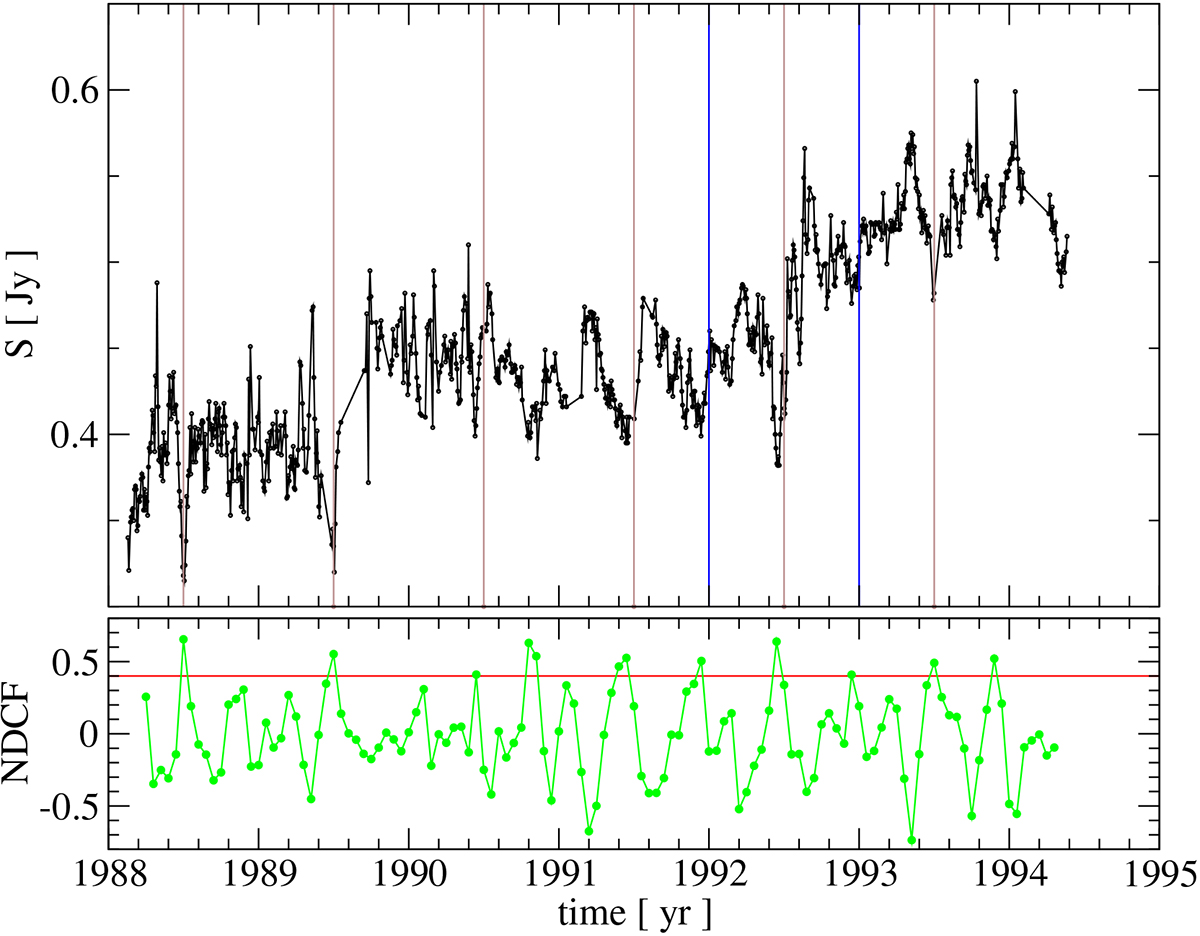
Fig. 8.
Download original image
Example of the automatic detection of ESE-like dips in the light curves. The lower panel shows the NDCF output for the light curve of the type IIb-SRV source 1830+285 (plotted in the upper panel). Events above the threshold of 0.4 (red horizontal line) are regarded as detections. Blue and brown vertical lines indicate, respectively, the time of minimum and maximum solar elongation of the source.
Current usage metrics show cumulative count of Article Views (full-text article views including HTML views, PDF and ePub downloads, according to the available data) and Abstracts Views on Vision4Press platform.
Data correspond to usage on the plateform after 2015. The current usage metrics is available 48-96 hours after online publication and is updated daily on week days.
Initial download of the metrics may take a while.