Fig. 7.
Download original image
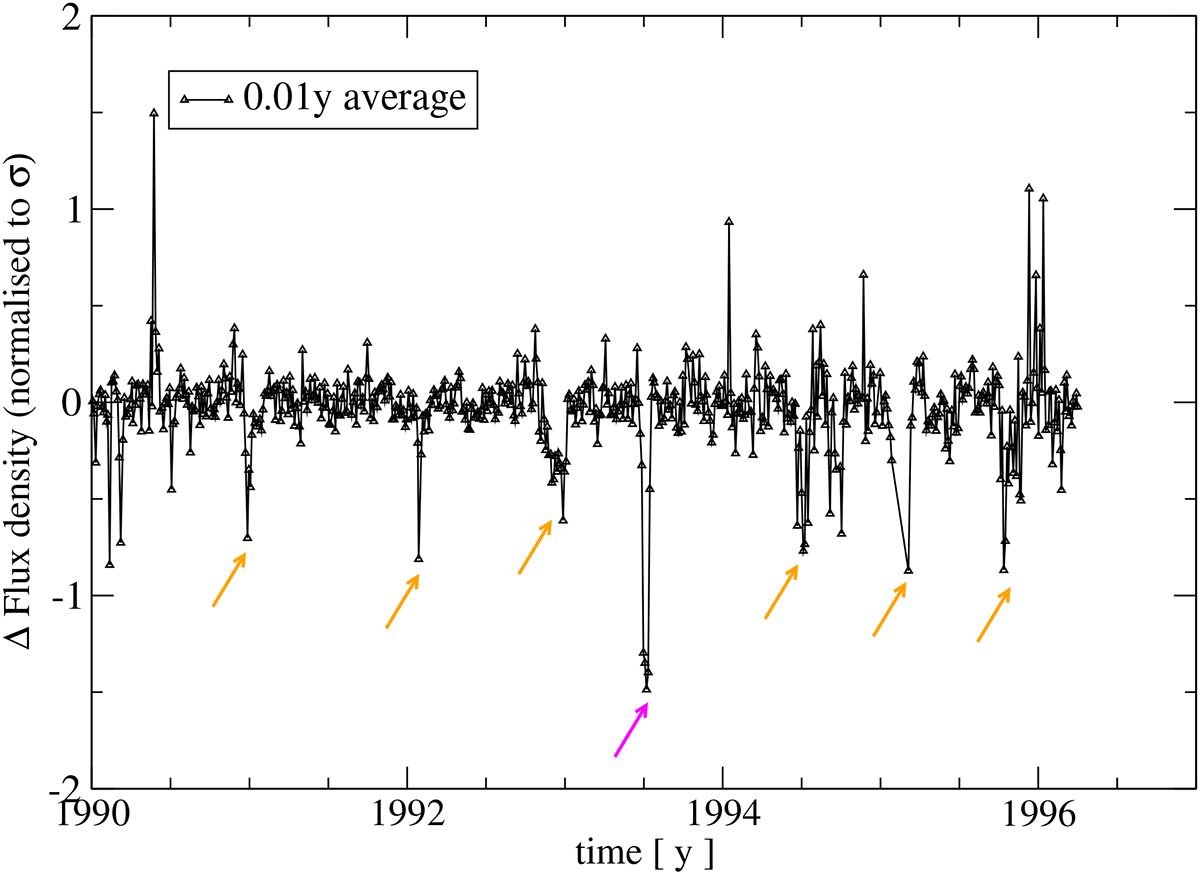
Combined 2 GHz variability curve of all the NESMP data. For each source, the flux densities have been de-trended and normalised according their standard deviation σ. Afterwards, the data of all the sources were stacked into a single light curve, which has been averaged over time bins of 0.01 yr. A one-year periodic ripple, resulting from the combination of the annual oscillations in the light curves, has been removed from the stacked data. The regular sequence of dips, with an average separation of 0.5 yr, is indicated with orange arrows, while a magenta arrow is reserved for the 1993.5 ESE.
Current usage metrics show cumulative count of Article Views (full-text article views including HTML views, PDF and ePub downloads, according to the available data) and Abstracts Views on Vision4Press platform.
Data correspond to usage on the plateform after 2015. The current usage metrics is available 48-96 hours after online publication and is updated daily on week days.
Initial download of the metrics may take a while.