Open Access
Fig. 5.
Download original image
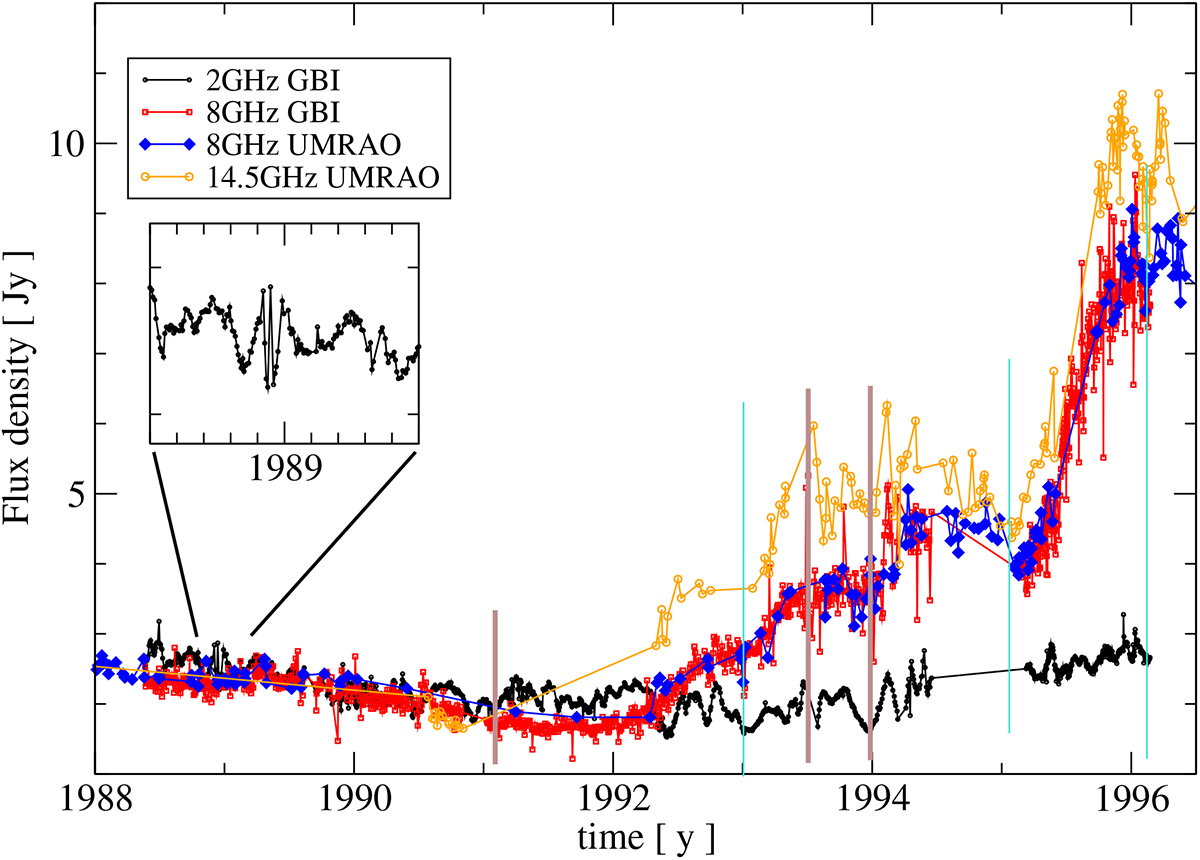
GBI and UMRAO light curves of 0528+134. Brown lines indicate the ESEs identified by Lazio et al. (2001a), while turquoise ones show three more simultaneous multi-frequency dips recognisable in the data. In the small box we show the 1988.9 event, a rare example of a complex ESE shape observable at 2 GHz.
Current usage metrics show cumulative count of Article Views (full-text article views including HTML views, PDF and ePub downloads, according to the available data) and Abstracts Views on Vision4Press platform.
Data correspond to usage on the plateform after 2015. The current usage metrics is available 48-96 hours after online publication and is updated daily on week days.
Initial download of the metrics may take a while.