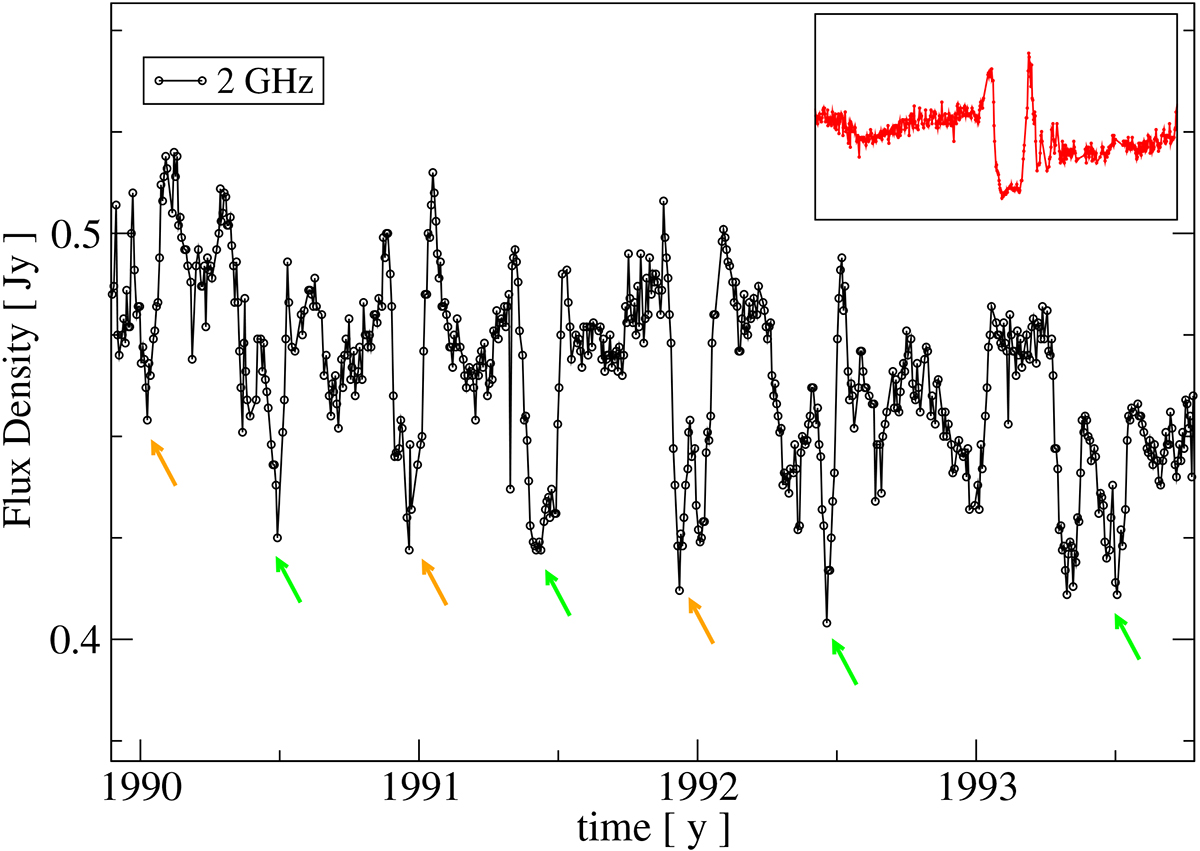
Fig. 4.
Download original image
Two gigahertz light curve of 0537-158. Between 1990 and 1993 the variability of the source appears as a sequence of six-month separated ESEs centred at the time of minimum and maximum solar elongation of the source (indicated, respectively, with green and orange arrows). In the upper-right box, as a comparison, a zoom-in on the 2 GHz 1981 event of 0954+658 is shown, which can be considered as the archetype of ESEs.
Current usage metrics show cumulative count of Article Views (full-text article views including HTML views, PDF and ePub downloads, according to the available data) and Abstracts Views on Vision4Press platform.
Data correspond to usage on the plateform after 2015. The current usage metrics is available 48-96 hours after online publication and is updated daily on week days.
Initial download of the metrics may take a while.