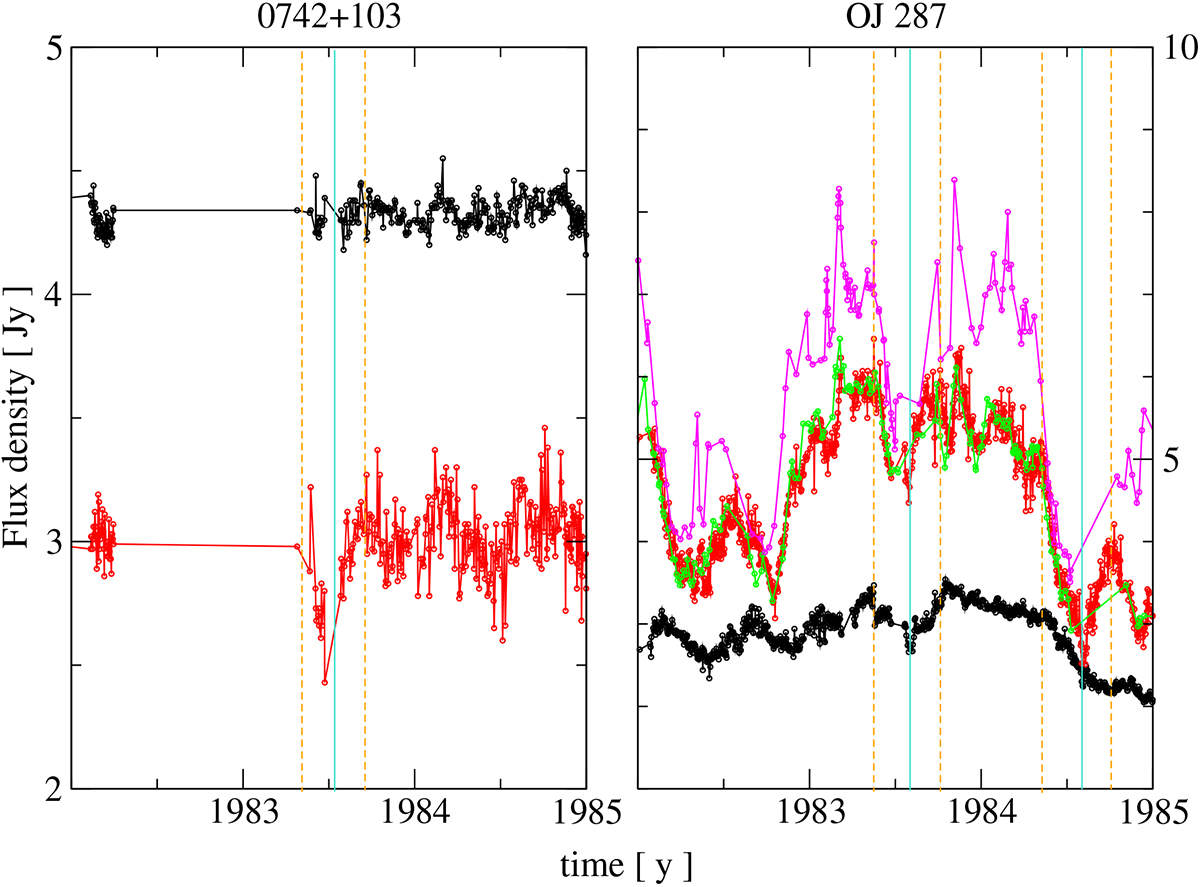
Fig. 3.
Download original image
Type IIa SRV event of 1983 in 0742+103 and OJ 287 (left and right panel, respectively). The event is stronger at 8 (red dots) than at 2 GHz (black dots) and even stronger at 14.5 GHz (magenta dots, from the UMRAO archive). We note that there is excellent agreement between GBI and UMRAO 8 GHz data (green dots). Turquoise lines mark the times of minimum solar elongation for the two sources, while orange lines indicate the beginning and end of the events.
Current usage metrics show cumulative count of Article Views (full-text article views including HTML views, PDF and ePub downloads, according to the available data) and Abstracts Views on Vision4Press platform.
Data correspond to usage on the plateform after 2015. The current usage metrics is available 48-96 hours after online publication and is updated daily on week days.
Initial download of the metrics may take a while.