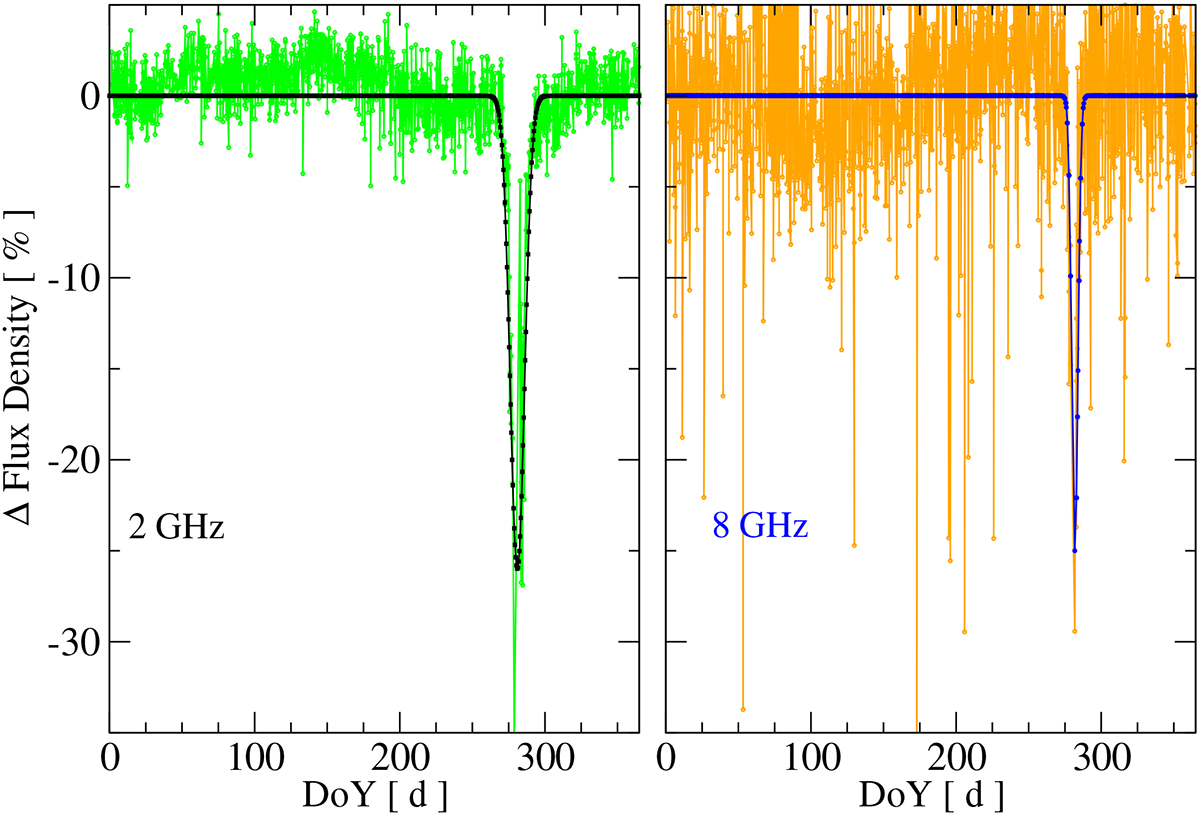
Fig. 2.
Download original image
Seasonal flux density variations of 1253-055 at 2 and 8 GHz, calculated by de-trending the light curves on bins of ten months. The de-trended data are plotted versus day of the year (DoY); black and blue squares show the best-fitting Gaussian models. At 2 GHz, the effect of the Sun starts around DoY 265 and ends around DoY 298, indicating an influence spreading to solar elongations up to ∼16°. For the 8 GHz data the influence is limited to ∼8°.
Current usage metrics show cumulative count of Article Views (full-text article views including HTML views, PDF and ePub downloads, according to the available data) and Abstracts Views on Vision4Press platform.
Data correspond to usage on the plateform after 2015. The current usage metrics is available 48-96 hours after online publication and is updated daily on week days.
Initial download of the metrics may take a while.