Fig. C.2.
Download original image
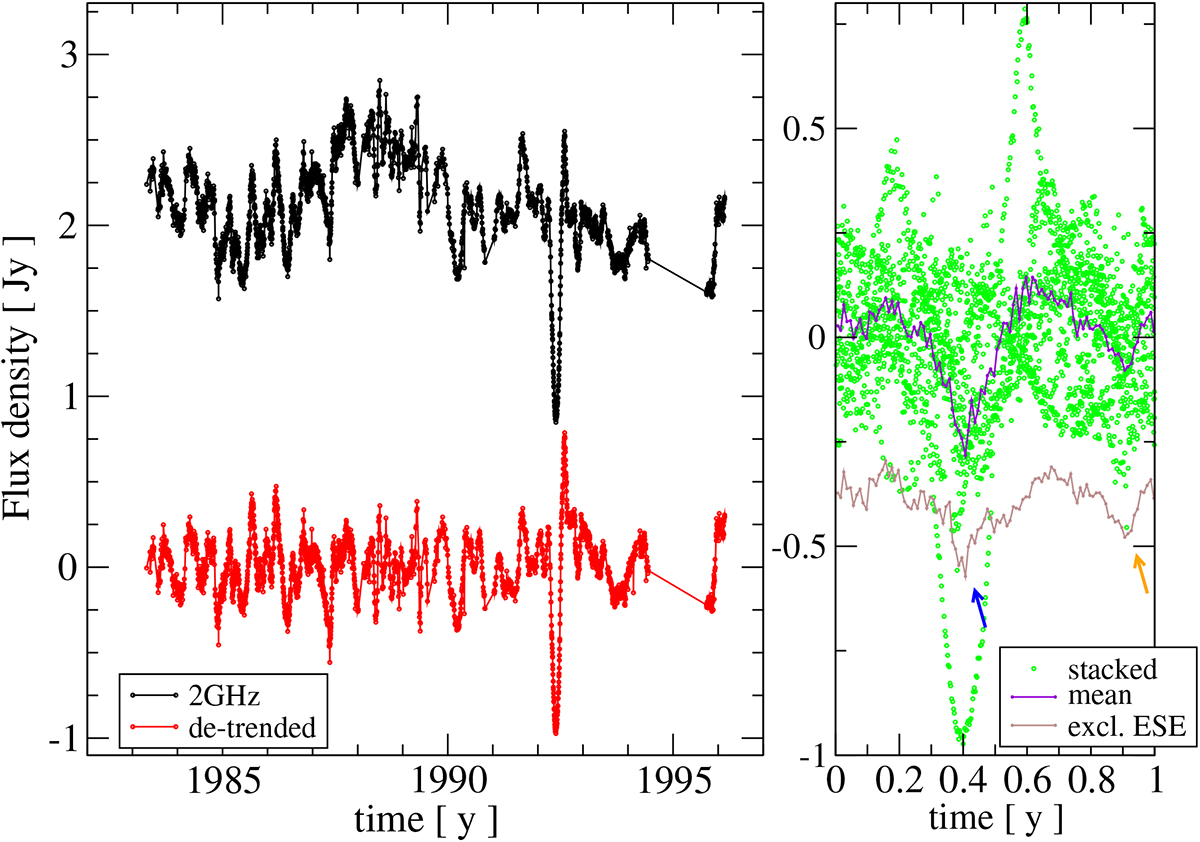
The dramatic SRV episode observed in the 1741-038 light curves in 1992. Left panel: In black, the 2 GHz light curve of 1741-038; the de-trended data are shown in red. Right panel: De-trended data, stacked on one-year intervals, are shown as green dots; averaged data are shown as violet dots, while stacked data not including the 1992.5 event are shown in brown, after shifting them in flux density for an easier comparison. At 2 GHz, the peak-to-dip difference in the 1992.4 event is about 40 times greater than the spread in the noise level of the source. As in the previous figure, blue and orange arrows indicate the time of maximum and minimum solar elongation of the source.
Current usage metrics show cumulative count of Article Views (full-text article views including HTML views, PDF and ePub downloads, according to the available data) and Abstracts Views on Vision4Press platform.
Data correspond to usage on the plateform after 2015. The current usage metrics is available 48-96 hours after online publication and is updated daily on week days.
Initial download of the metrics may take a while.