Fig. C.1.
Download original image
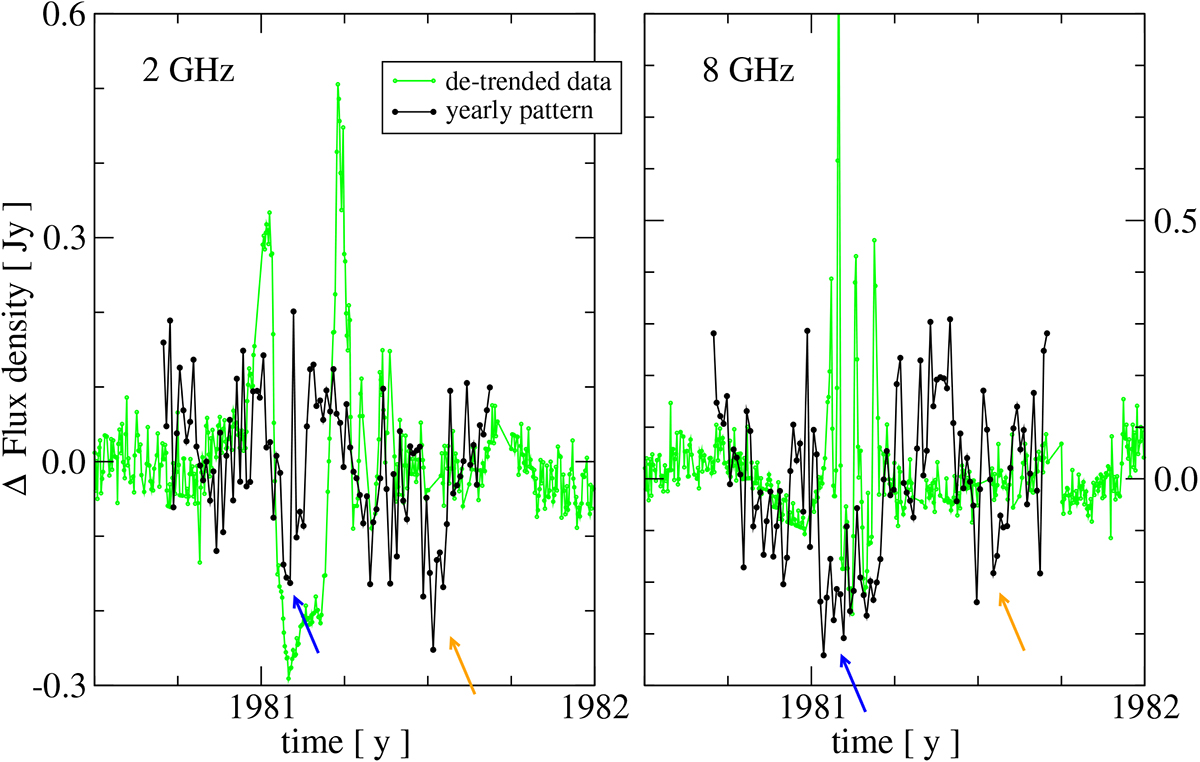
De-trended 2 and 8 GHz light curves of 0954+658 (left and right panel respectively, green dots) plotted together with the average yearly pattern obtained after removing the data points covering the 1981.1 event while stacking the remaining data and averaging them (black dots). The stacked data are multiplied by a factor nine for a better comparison between the datasets. The peak-to-dip difference in the 1981.1 event is about 20 times greater than the spread in the noise level of the source. Blue and orange arrows indicate the time of maximum and minimum solar elongation of the source.
Current usage metrics show cumulative count of Article Views (full-text article views including HTML views, PDF and ePub downloads, according to the available data) and Abstracts Views on Vision4Press platform.
Data correspond to usage on the plateform after 2015. The current usage metrics is available 48-96 hours after online publication and is updated daily on week days.
Initial download of the metrics may take a while.