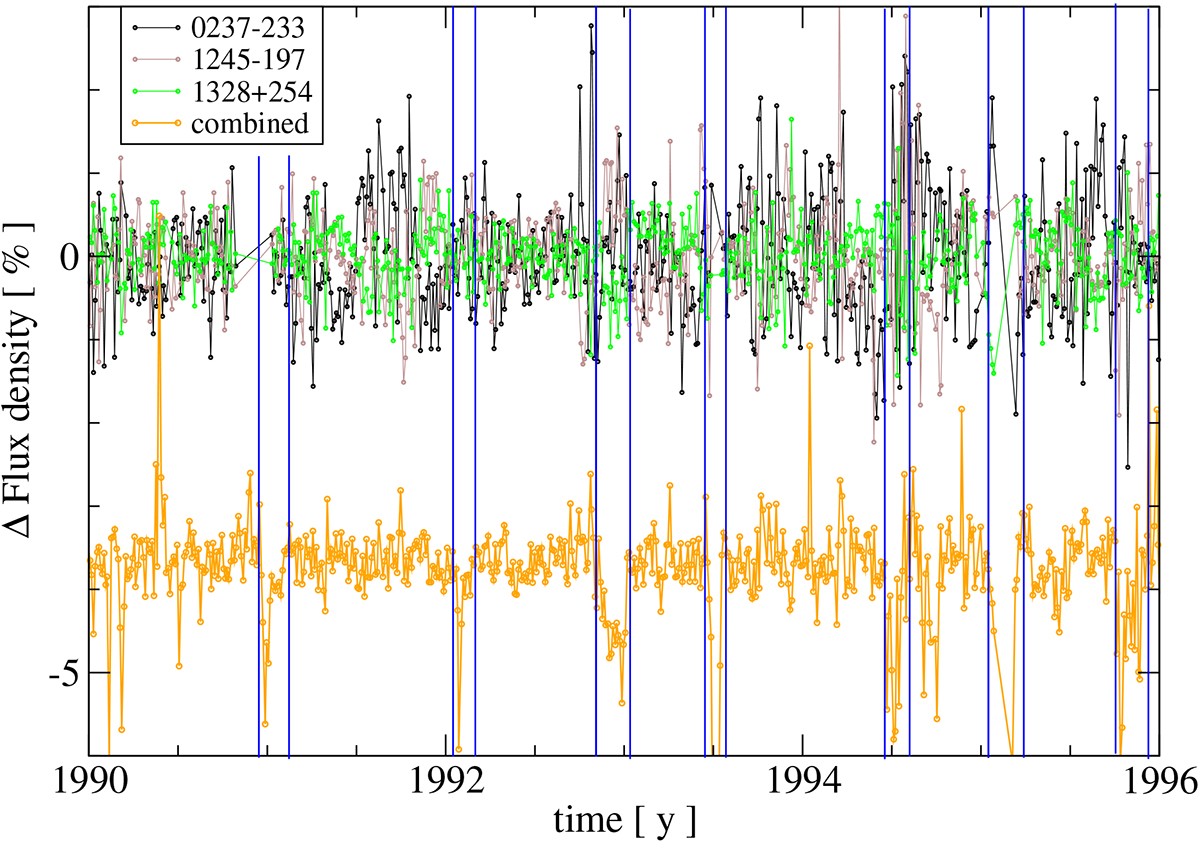
Fig. A.1.
Download original image
Comparison between the de-trended calibrators’ light curves and the combined 2 GHz variability curve plotted in Fig. 7. Data are averaged on 0.02 yr bins; the combined variability curve is arbitrarily shifted for an easier comparison. Blue lines indicate the start and the end of the semi-annual ESE-like episodes in the combined variability curve.
Current usage metrics show cumulative count of Article Views (full-text article views including HTML views, PDF and ePub downloads, according to the available data) and Abstracts Views on Vision4Press platform.
Data correspond to usage on the plateform after 2015. The current usage metrics is available 48-96 hours after online publication and is updated daily on week days.
Initial download of the metrics may take a while.