Fig. 11.
Download original image
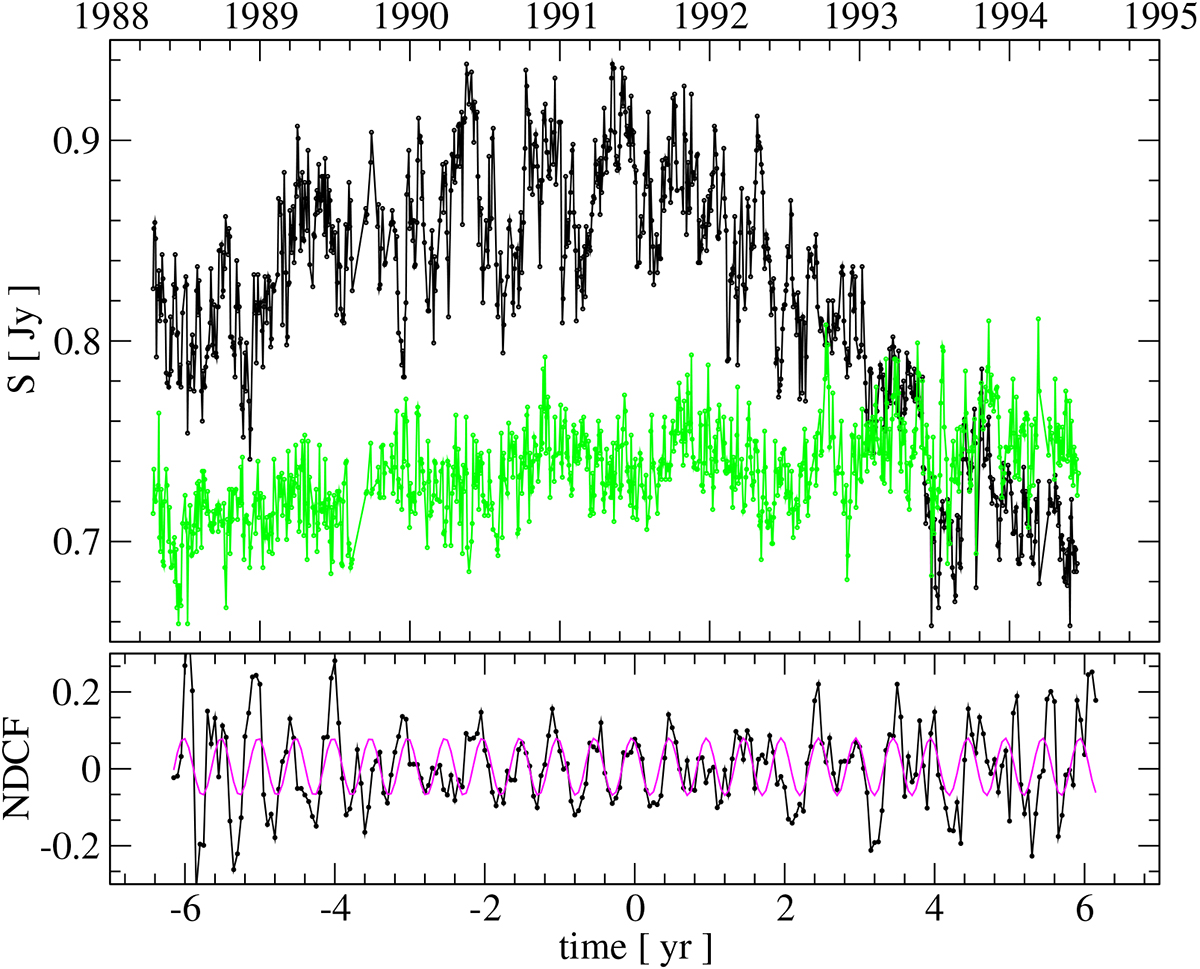
Correlated semi-annual variability in angularly nearby sources. Upper panel: Light curves of the strong type IIb source 0922+005 (black dots) and of 0837+035 (green dots). The NDCF between the de-trended light curves is shown in the lower panel; it reveals a 0.5 yr periodic modulation (magenta line) with a time delay that is consistent with the difference in the solar elongation minima of the objects.
Current usage metrics show cumulative count of Article Views (full-text article views including HTML views, PDF and ePub downloads, according to the available data) and Abstracts Views on Vision4Press platform.
Data correspond to usage on the plateform after 2015. The current usage metrics is available 48-96 hours after online publication and is updated daily on week days.
Initial download of the metrics may take a while.