Fig. A.1
Download original image
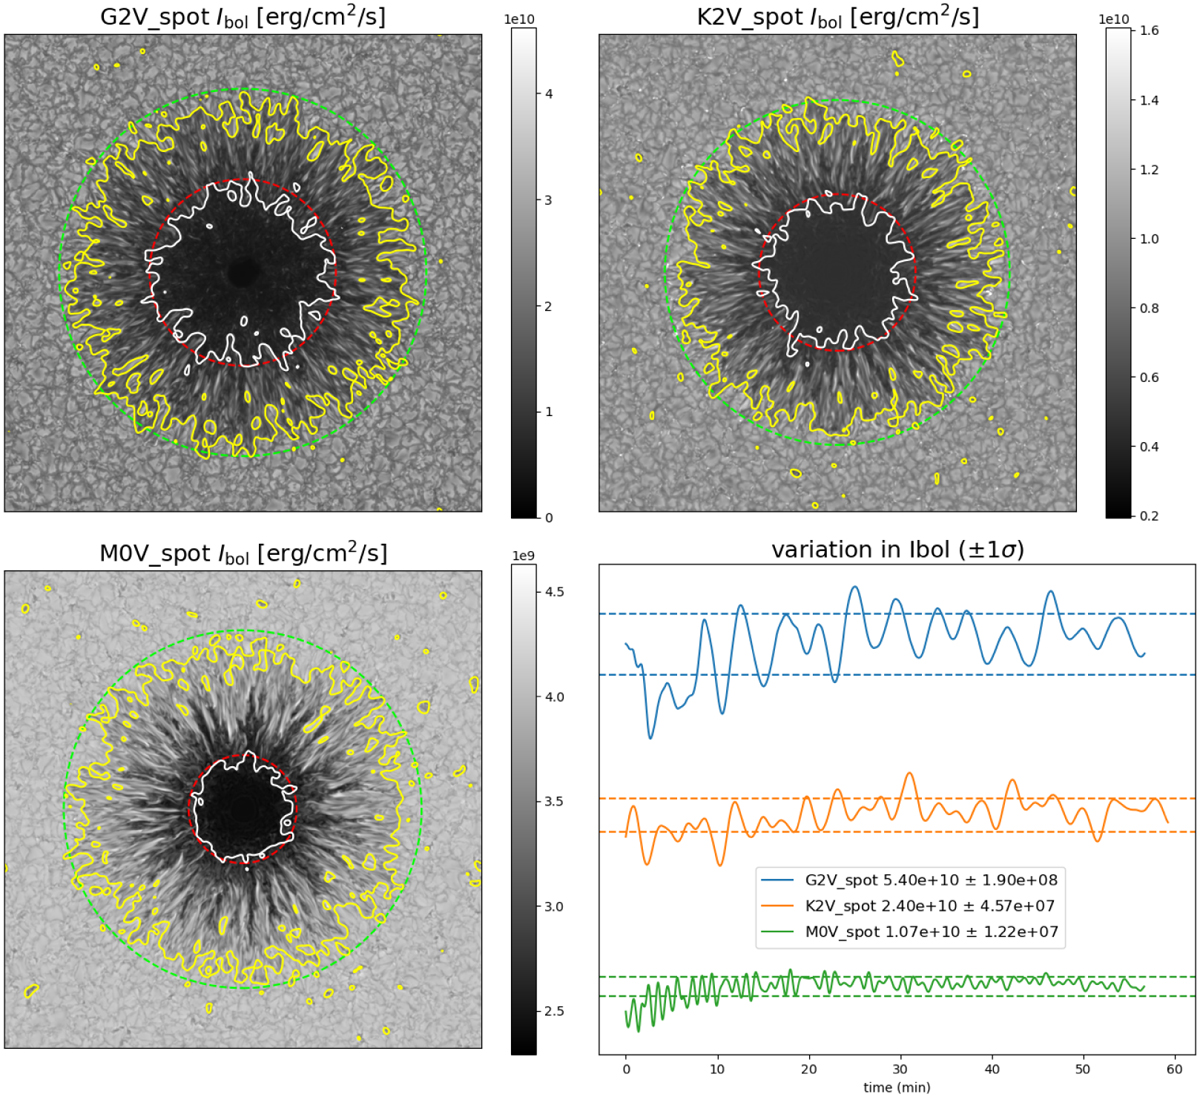
Snapshots of bolometric intensity Ibol for G2V (top left), K2V (top right), and M0V (bottom left) spot. The bottom right plot shows the variation in bolometric intensity on an arbitrary axis, with ±1σ standard deviation horizontal dashed lines. The mean and standard deviation values are mentioned in the figure label. See the corresponding text in Appendix A for details regarding the contours.
Current usage metrics show cumulative count of Article Views (full-text article views including HTML views, PDF and ePub downloads, according to the available data) and Abstracts Views on Vision4Press platform.
Data correspond to usage on the plateform after 2015. The current usage metrics is available 48-96 hours after online publication and is updated daily on week days.
Initial download of the metrics may take a while.